
Muncie Forecast 2019

Director of Research, Center for Business and Economic Research, Ball State University

Graduate Assistant, Center for Business and Economic Research, Ball State University
The Muncie area economy continued to grow slowly over the past year. The unemployment rate decreased substantially. Nonfarm employment increased by less than 1 percent, while average weekly wages increased by about 6 percent. The number and amount of food stamps issued decreased substantially. The number of building permits issued actually decreased relative to the previous year and are much lower than pre-recession levels.
The two biggest news stories are continuations of events that began in previous years and are not directly related to the business sector but will affect local businesses, economic development prospects and the ability of Muncie to attract new households to live in the area. First, in September 2018, media reported that another Muncie government official and a local businessman face charges related to the ongoing FBI investigation into alleged corruption in Muncie city government.1 The investigation continues. Second, during the May 2018 special session, the Indiana General Assembly passed a bill authorizing Ball State University to take control of Muncie Community Schools, the largest school corporation in the county, beginning July 2018.2
Some of the highlights from 2018’s business news included the closing of two of the four Muncie Mall anchor stores, Carson’s and Sears.3 Payless Supermarkets opened in two former Marsh locations and Fresh Thyme opened on the north side of Muncie. AquaBounty Technologies modified the former Bell Aquaculture plant to produce genetically engineered salmon.4
More manufacturing facilities announced closures, including the Muncie Jarden plant that produces canning jar lids and a metal components plant owned by JD Norman Industries (130 jobs).5 On a brighter note, Italian company Filtrec S.p.A is planning to open a manufacturing facility in Daleville that will serve as its North American headquarters and create about 25 jobs.6
This article includes the most current data available on various measures of economic activity from public sources for the Muncie MSA (Delaware County) to analyze changes over the past year. A summary of the labor market forecast for the Muncie area is included in the conclusion.
Labor markets
The unemployment rate decreased from 4.1 percent in January to 3.3 percent in September (see Table 1). This September rate is lower than one year ago (3.9 percent in September 2017). Delaware County’s unemployment rate continues to be higher than Indiana’s rate of 3.0 percent (not seasonally adjusted) as of September 2018. The labor force in the Muncie MSA ranged between 54,000 and 56,000 people during the year, peaking in April at 56,173 people. This is higher than the pre-recession peak of approximately 55,750.
Table 1: Labor force and unemployment in the Muncie metro
| Year | Month | Labor force | Unemployment | Unemployment rate |
|---|---|---|---|---|
| 2017 | September | 55,333 | 2,161 | 3.9 |
| October | 55,356 | 2,062 | 3.7 | |
| November | 55,294 | 2,155 | 3.9 | |
| December | 54,555 | 1,988 | 3.6 | |
| 2018 | January | 54,188 | 2,205 | 4.1 |
| February | 55,383 | 2,383 | 4.3 | |
| March | 55,686 | 2,103 | 3.8 | |
| April | 56,173 | 1,863 | 3.3 | |
| May | 55,385 | 2,063 | 3.7 | |
| June | 55,727 | 2,378 | 4.3 | |
| July | 55,888 | 2,266 | 4.1 | |
| August | 55,218 | 2,384 | 4.3 | |
| September | 55,720 | 1,855 | 3.3 |
Note: Data are not seasonally adjusted.
Source: U.S. Bureau of Labor Statistics
We use the monthly average of employment over the first three quarters of the year to examine changes in industry employment in the Muncie MSA. Nonfarm employment increased in 2018 adding just under 400 jobs (0.8 percent) relative to the previous year (see Table 2). Nonfarm employment has increased each year since 2014 and is approaching pre-recession levels (52,844). The largest employment decrease over the past year occurred in the leisure and hospitality sector (2.7 percent). Two sectors had no change from 2017: other services and the information sector. The remaining sectors experienced considerable increases, with the government sector experiencing the largest increase, up 500 jobs since 2017 (3.9 percent).
Table 2: Year-to-date Muncie MSA employment
| Industry | 2014 | 2015 | 2016 | 2017 | 2018 | Change since 2017 | Percent change, 2017-2018 |
|---|---|---|---|---|---|---|---|
| Total nonfarm | 49,389 | 50,711 | 51,000 | 51,844 | 52,233 | 389 | 0.8% |
| Total private | 37,011 | 37,811 | 38,433 | 38,867 | 38,756 | -111 | -0.3% |
| Goods-producing | 5,644 | 5,789 | 5,856 | 5,800 | 5,844 | 44 | 0.8% |
| Manufacturing | 4,178 | 4,311 | 4,311 | 4,300 | 4,344 | 44 | 1.0% |
| Private service-providing | 31,367 | 32,022 | 32,578 | 33,067 | 32,911 | -156 | -0.5% |
| Trade, transportation and utilities | 8,867 | 8,933 | 8,989 | 8,856 | 8,800 | -56 | -0.6% |
| Information | 300 | 300 | 300 | 300 | 300 | 0 | 0.0% |
| Financial activities | 2,422 | 2,444 | 2,500 | 2,433 | 2,444 | 11 | 0.5% |
| Private educational and health services | 8,356 | 8,211 | 8,544 | 8,900 | 9,000 | 100 | 1.1% |
| Leisure and hospitality | 4,944 | 5,089 | 5,444 | 5,278 | 5,133 | -144 | -2.7% |
| Other services | 1,889 | 1,867 | 1,800 | 1,800 | 1,800 | 0 | 0.0% |
| Private service-producing—residual | 4,538 | 5,178* | 5,000* | 5,500* | 5,433* | -67 | -1.2% |
| Government (includes public schools and hospitals) | 12,378 | 12,900 | 12,567 | 12,978 | 13,478 | 500 | 3.9% |
*Estimated using available data
Note: All data are January through September averages.
Source: U.S. Bureau of Labor Statistics and Indiana Department of Workforce Development
Quarter 1 average weekly wages in Delaware County increased from $734 to $763 (4.0 percent), as seen in Table 3. This marks the highest year for average weekly wages since 2001, with 2017 and 2015 being the second- and third-highest years ($734 and $725, respectively, not adjusted for inflation). Wages in the Muncie MSA continue to be considerably lower than the state average, which has increased from $918 to $954 (3.9 percent) from 2017 to 2018. This is the largest discrepancy between state and local average wages in the past 17 years, with 2017 being a close second ($191 difference versus $184 difference).
Table 3: Average weekly wages in Muncie MSA
| Industry | 2014 Q1 | 2015 Q1 | 2016 Q1 | 2017 Q1 | 2018 Q1 | Change, 2017-2018 | Percent change, 2017-2018 |
|---|---|---|---|---|---|---|---|
| Total | $705 | $725 | $693 | $734 | $763 | 29 | 4.0% |
| Management of companies and enterprises | $2,072 | $2,475 | $2,221 | $2,206 | $2,233 | 27 | 1.2% |
| Utilities | $1,800 | $1,730 | $1,799 | $2,155 | $1,985 | -170 | -7.9% |
| Wholesale trade | $966 | $1,046 | $987 | $1,038 | $1,133 | 95 | 9.2% |
| Finance and insurance | $960 | $964 | $882 | $1,035 | $1,094 | 59 | 5.7% |
| Manufacturing | $887 | $921 | $932 | $963 | $982 | 19 | 2.0% |
| Professional, scientific and technical services | $840 | $836 | $846 | $891 | $945 | 54 | 6.1% |
| Educational services | $852 | $820 | $827 | $872 | $895 | 23 | 2.6% |
| Transportation and warehousing | $807 | $827 | $780 | $823 | $881 | 58 | 7.0% |
| Information | $768 | $740 | $811 | $871 | $859 | -12 | -1.4% |
| Health care and social services | $776 | $810 | $775 | $814 | $819 | 5 | 0.6% |
| Construction | $711 | $771 | $782 | $812 | $818 | 6 | 0.7% |
| Public administration | $665 | $709 | $723 | $731 | $761 | 30 | 4.1% |
| Real estate and rental and leasing | $652 | $689 | $665 | $642 | $751 | 109 | 17.0% |
| Administrative, support, waste management and remediation | $455 | $465 | $430 | $534 | $674 | 140 | 26.2% |
| Retail trade | $446 | $449 | $451 | $484 | $507 | 23 | 4.8% |
| Other services (except public administration) | $439 | $464 | $449 | $480 | $499 | 19 | 4.0% |
| Arts, entertainment and recreation | $260 | $275 | $274 | $302 | $342 | 40 | 13.2% |
| Accommodation and food services | $232 | $245 | $249 | $262 | $271 | 9 | 3.4% |
Source: U.S. Bureau of Labor Statistics and Indiana Department of Workforce Development
Only two industry sectors (the utilities sector and the information sector) saw declining average weekly wages in 2018. Once again, a vast majority of the industry sectors in 2018 (16 out of 18) experienced positive increases in weekly wages ranging from 0.6 to 26.2 percent. The greatest increase took place in the administration, support, waste management and remediation services sector (26.2 percent). Two other sectors also had increases exceeding 10 percent: real estate and rental and leasing (17.0 percent) and arts, entertainment and recreation (13.2 percent).
The inflation rate from the first quarter of 2017 to that of 2018 was 1.7 percent, so workers in 13 of the 18 sectors experienced real wage growth over this period.7
Housing
Building permit activity continues to be lower than pre-recession levels. There were 10 new residential building permits issued in Muncie during 2018, increasing 25 percent from last year (see Table 4). Single-family construction were the only new permits; no multifamily permits were issued during 2018.
Table 4: City of Muncie year-to-date residential building permits
| Year | Total | Single-family | Multifamily |
|---|---|---|---|
| 2002 | 34 | 33 | 1 |
| 2003 | 38 | 23 | 15 |
| 2004 | 17 | 16 | 1 |
| 2005 | 26 | 25 | 1 |
| 2006 | 22 | 19 | 3 |
| 2007 | 35 | 28 | 7 |
| 2008 | 25 | 23 | 2 |
| 2009 | 6 | 6 | 0 |
| 2010 | 6 | 5 | 1 |
| 2011 | 33 | 29 | 4 |
| 2012 | 0 | 0 | 0 |
| 2013 | 10 | 10 | 0 |
| 2014 | 14 | 13 | 1 |
| 2015 | 3 | 3 | 0 |
| 2016 | 16 | 15 | 1 |
| 2017 | 8 | 6 | 2 |
| 2018 | 10 | 10 | 0 |
Note: Each year is based on January through August totals for building permits
issued within Muncie city limits.
Data were unavailable for permits issued in
Yorktown or unincorporated areas of Delaware County.
Source: U.S. Census Bureau
The Federal Housing Finance Agency’s house price index is a broad measure of single-family house price movements. The index was flat during the first two quarters of 2018 but increased 4 percent relative to the previous year (see Figure 1).8 Housing prices in the Muncie area grew more slowly than the state as a whole. Indiana house prices increased 7.5 percent over the same period.
Figure 1: Muncie MSA quarterly single-family housing price index
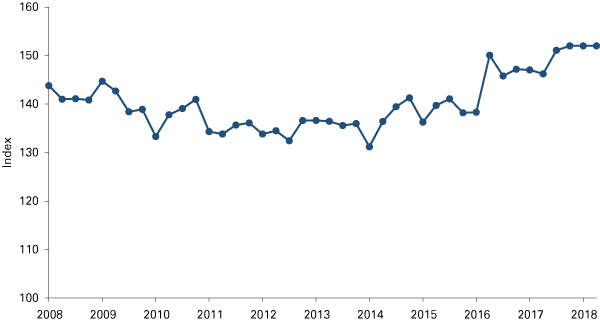
Source: Federal Housing Finance Agency house price index (all transactions)
Social safety net
With increases in employment and wages in the metro area, the dollar amount of food stamps issued continued to decrease (see Table 5). Delaware County issued about $1.6 million per month in food stamps in 2018. This is a 7.5 percent decrease since 2017 and the smallest amount issued since 2008. The number of food stamp recipients decreased to 13,678 (-6.4 percent), which is the lowest since 2008, while the number of households receiving food stamps decreased to 6,572 (-6.1 percent), also the lowest since 2008.
Table 5: Food stamp recipients in Delaware County
| Delaware County | Total food stamps issued (monthly average) | Number of food stamp recipients (monthly average) | Number of households receiving food stamps (monthly average) |
|---|---|---|---|
| 2008 | $1,406,896 | 13,010 | 6,165 |
| 2009 | $1,885,016 | 14,225 | 6,626 |
| 2010 | $2,302,577 | 16,915 | 7,804 |
| 2011 | $2,504,694 | 18,589 | 8,746 |
| 2012 | $2,653,532 | 19,780 | 9,518 |
| 2013 | $2,740,242 | 20,453 | 9,934 |
| 2014 | $2,463,746 | 19,839 | 9,712 |
| 2015 | $2,382,671 | 18,691 | 9,287 |
| 2016 | $1,973,066 | 16,204 | 7,828 |
| 2017 | $1,772,604 | 14,614 | 7,000 |
| 2018 | $1,639,903 | 13,678 | 6,572 |
Note: Each year is based on January through August monthly averages. Dollar amounts are not adjusted for inflation.
Source: STATS Indiana, using Family and Social Services Administration data
Outlook
The past year provided evidence that Muncie is continuing its long, slow recovery. The unemployment rate showed some variation over the past year as more people entered the labor force looking for jobs, but ultimately decreased in the latest reported data. Meanwhile, nonfarm employment is finally approaching pre-recession levels. Housing construction, measured by the number of building permits issued, remains sluggish, and residential housing prices increased relative to the previous year. Wages continue to increase (but remain considerably lower than the state average), and fewer households are relying on the social safety net as food stamp usage has decreased.
The Indiana University Center for Econometric Model Research’s forecast projects that Muncie MSA employment will grow by just over half a percent during 2019 and then slow down during the next few years. Income is projected to grow at 3.6 percent during 2019.9 Population growth projections remain flat.
Notes
- K. Roysdon. “Muncie official, businessman face federal fraud-related charges,” The Star Press, September 18, 2018.
- S. Slabaugh, “House, Senate OK Ball State takeover of Muncie schools,” The Star Press, May 14, 2018.
- K. Roysdon. “Can Muncie Mall survive the low of anchor stores?” The Star Press, June 21, 2018.
- S. Slabaugh. “Genetically-engineered-salmon farm in Delaware County awaits eggs,” The Star Press, May 18, 2018.
- K. Roysdon, “Muncie Jarden plant, vestige of Ball, to close,” The Star Press, July 10, 2018. K. Roysdon, “Metal components maker to close Muncie plant, costing 130 jobs by end of 2018,” The Star Press, October 19, 2018.
- C. Ohlenkamp. “Italy-based company looks to call Daleville home,” The Star Press, October 14, 2018.
- Inflation rate for Midwest region using the CPI for all urban consumers, not seasonally adjusted.
- In the past, we have used data from the Mid-Eastern Indiana Association of Realtors (MEIAR) to provide more detailed information about the real estate market in east-central Indiana. However, we were unable to obtain those data for this article.
- Forecasts come from the Indiana University Center for Econometric Model Research (https://ibrc.kelley.iu.edu/analysis/cemr/), September 2018.
