Evansville forecast 2019

Professor of Economics and Interim Provost, University of Southern Indiana
Traditional indicators of local economic success, such as job growth, do not always translate into greater economic mobility. A new publicly available online data visualization tool, The Opportunity Atlas (available at http://opportunityatlas.org/) traces outcomes, such as poverty, back to the neighborhoods in which children grew up. The tool, which focuses on the neighborhoods where people grew up rather than where they live as adults, provides support for the idea that the neighborhood in which a child grows up has substantial influence on his or her prospects of upward mobility. The Opportunity Atlas highlights the uneven distribution of economic opportunities across geographic areas and its correlation with the incidence of income inequality. In the Evansville MSA, economic mobility and income inequality are key considerations in designing strategies for advancing economic well-being and the quality of life of its residents.
During 2018, relatively strong growth in the construction and manufacturing sectors combined with increases in personal income and announcements of future fixed investments provide the basis for projecting increased employment, output and income in 2019.
An announcement in October by RB, a global health and hygiene company, to invest in operational efficiencies, as well as construction projects completed in 2018—such as a medical campus in downtown Evansville, a land-based casino and renovations at the Evansville Regional Airport—will continue to boost economic activity in 2019.
Once all data are released for 2018, nominal personal income is estimated to have increased by 4.1 percent and real gross metro product is estimated to have increased by 3.1 percent.
In 2019, Evansville metro area output is forecasted to increase by 2.2 percent. The number of jobs is projected to increase by 2,500, while the unemployment rate is projected to be 2.8 percent. Meanwhile, nominal personal income growth is forecasted to increase by 4.2 percent.
The unemployment rate in the Evansville metro increased slightly from 3.2 percent in January 2018 to 3.5 percent in September 2018. There was a decline in the national unemployment rate from 4.1 percent to 3.7 percent over the same time period. Job gains occurred primarily in the following sectors: manufacturing, construction, retail trade, and transportation, warehousing and utilities. The primary activities experiencing jobs losses were in the information sector and the other services sector.
Between 2017 and 2018, homeowners experienced an increase in existing-home prices from an average of $153,451 to $157,260, while housing starts decreased from 874 to 600.
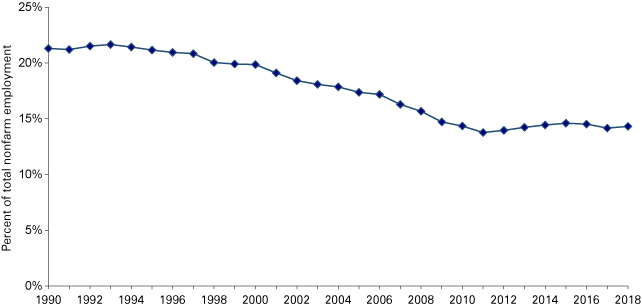
The manufacturing sector continues to be an important base to local household incomes and consumer spending activity, even as the economy exhibits a long-term pattern of diversification away from manufacturing-industry dependence (see Figure 1).
Figure 1: Evansville metro manufacturing employment as a percent of total nonfarm employment

Note: 2018 data are for September.
Source: STATS Indiana, using U.S. Bureau of Labor Statistics and Indiana Department of Workforce Development data
As one of the most manufacturing-dependent metro areas in the nation, the Evansville economy was noticeably impacted by the Great Recession. Since 2007, Evansville’s manufacturing workforce has fallen by 7.8 percent or about 2,000 workers, compared to the 3.0 percent reduction in Indiana’s manufacturing workforce over the same period. In 2018, manufacturing earnings continue to be a significant driver of economic activity, accounting for about 26 percent of total earnings in the Evansville economy. As Table 1 shows, the manufacturing sector accounts for 14.3 percent of employment in the Evansville metro.
Table 1: Manufacturing's percent of total employment, September 2018
| Evansville metro | Indiana | U.S. | |
|---|---|---|---|
| Manufacturing | 14.3% | 16.8% | 8.5% |
| Durables | 37.9% | 72.6% | 62.4% |
| Nondurables | 62.1% | 27.4% | 37.6% |
Source: STATS Indiana, using U.S. Bureau of Labor Statistics and
Indiana Department of Workforce Development data
Given the proportion of output that is sold outside the metro area, the strength of the recovery in the Evansville area is linked to the strength of the broader economy. As employment and demand for locally produced goods continue to surpass pre-recession levels, disposable income and output growth are expected to increase in 2019.
A widening gap between the Evansville economy and the U.S. economy with regard to growth in income over the past three decades highlights the importance of achieving higher rates of future output and employment growth. Strategies aimed at addressing declining patterns of economic mobility merit attention.


