
Which Hoosiers are successfully navigating the unemployment system?
Assistant Professor, University of Indianapolis, School of Business
During periods of economic downturns and personal misfortune, unemployment services can offer a helping hand in regaining a foothold in the employment market for many Hoosiers. To better understand the composition of Hoosiers taking advantage of such services, this article analyzes a snapshot of Hoosiers accepting unemployment benefits over a 10-year period.
The data are longitudinal and include individual de-identified Indiana unemployment claimant data that are linked to wage records. Aggregated results are provided (and any incomplete observations were discarded). The data include observations from the first quarter of 2006 through the fourth quarter of 2015. (Data prior to 2006 were incomplete, and while data post-2015 were available, insufficient time had elapsed to allow for re-entry into the workplace.)
This information is based on individuals applying for Indiana unemployment insurance (UI) claim benefits. A person may appear multiple times in the claims data during this period. Each instance of an individual having a UI claim was considered a “unique episode.” Each claims episode was then matched to the individual’s wages before and after the claims episode and each matched claims episode is considered a unique observation.
Individuals without wage matches on both sides of the UI claim time period were excluded from the study. This process undoubtedly excludes those unable to find work after receiving UI benefits. It also excludes individuals coming into Indiana for work, leaving the state for employment or becoming self-employed. The matched wage records only include wages of individuals employed by companies covered by unemployment insurance. Wage data for the self-employed and those outside Indiana were unattainable and beyond the reach of this analysis. Unsurprisingly, the observation counts spike in response to the recession of 2008-2009 and generally decrease after that time (see Figure 1).
Figure 1: Indiana unemployment claim observations for those successfully moving through the system
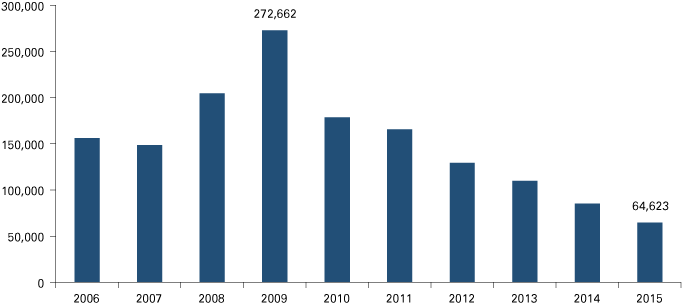
Note: This analysis only includes those individuals with wage matches on both sides of the UI claim.
Source: Data provided by the Indiana Department of Workforce Development, in cooperation with the Indiana Management Performance Hub (MPH)
Figure 2 shows the home county of these claimants. Marion County made up 14 percent of the total with 214,183 claimant observations. Allen County was home to 6 percent of the total claimants in this data set.
Figure 2: Home county of claimants
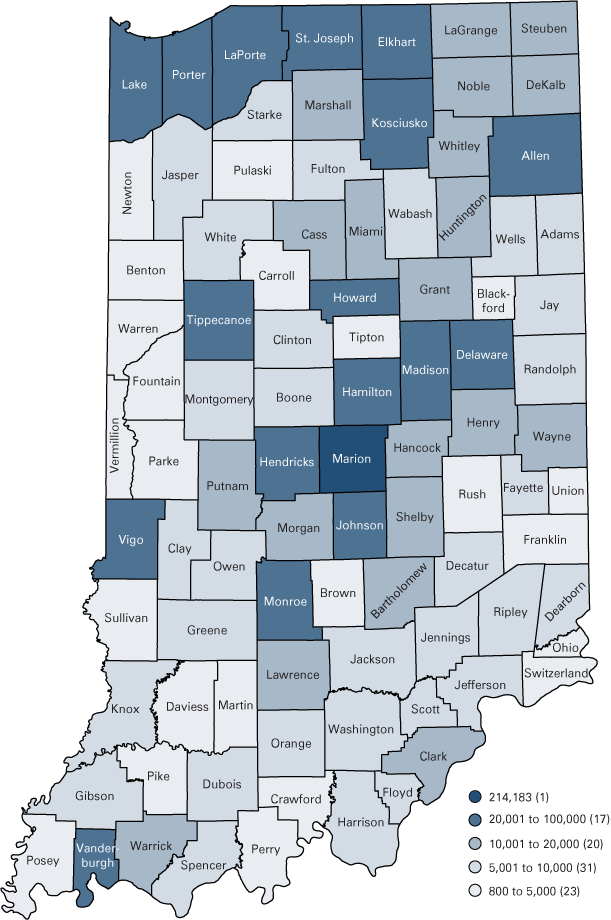
Note: There are 46,928 observations lacking county data.
Source: Data provided by the Indiana Department of Workforce Development, in cooperation with the Indiana Management Performance Hub (MPH)
Demographics
Nearly 65 percent of those successfully moving through the system (from work to unemployment and back to work) were male and 35 percent were female (see Figure 3). The remaining 0.03 percent of claimants were other/no response/incomplete or erroneous data.
Figure 3: Gender of claimants
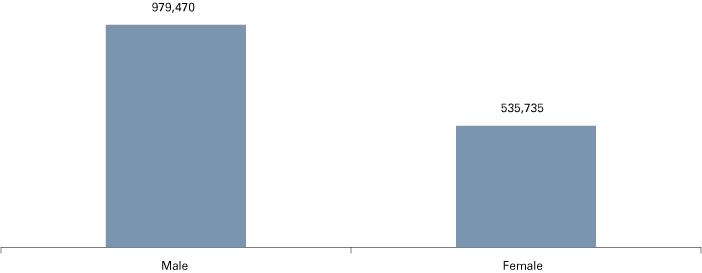
Source: Data provided by the Indiana Department of Workforce Development, in cooperation with the Indiana Management Performance Hub (MPH)
As shown in Figure 4, 82 percent of the claimants were white and 12 percent were black. (For comparison, whites made up 86 percent of the total Indiana population in 2015, compared to 10 percent for blacks.)
Figure 4: Race of claimants
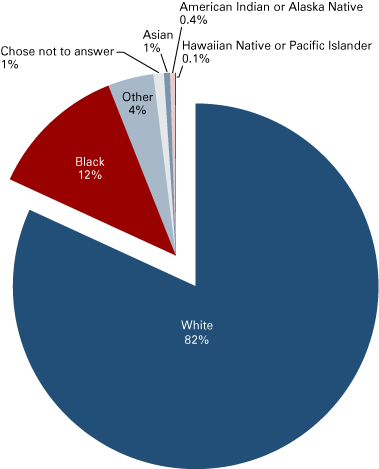
Source: Data provided by the Indiana Department of Workforce Development, in cooperation with the Indiana Management Performance Hub (MPH)
Education
The majority of individuals receiving benefits and successfully finding employment afterward had a high school diploma (see Figure 5). This finding is consistent with prior studies, which have consistently shown lower unemployment rates associated with increasing levels of education. Approximately 90 percent of Hoosiers claiming unemployment benefits and finding subsequent work in Indiana had less than a bachelor’s degree.
Figure 5: Educational attainment level of claimants
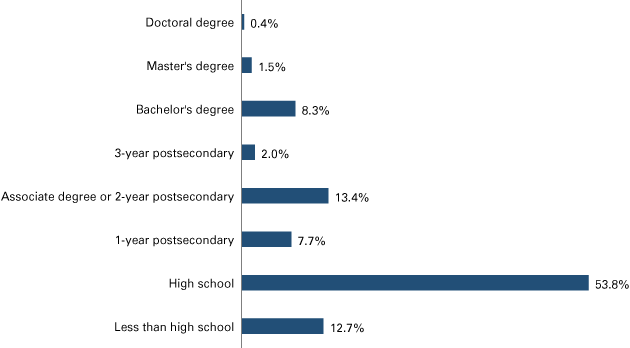
Note: There are 3,088 observations lacking attainment data.
Source: Data provided by the Indiana Department of Workforce Development, in cooperation with the Indiana Management Performance Hub (MPH)
Occupation and industry
Using two-digit occupational (SOC) and industry (NAICS) codes, a majority of the prior occupations of claimants tended to concentrate in lower-skilled positions in the retail and wholesale industry sectors (see Figure 6 and Figure 7). However, this is not universal as some skilled positions, particularly in manufacturing and construction, were also heavily hit in the last recession.
Figure 6: Occupation before unemployment
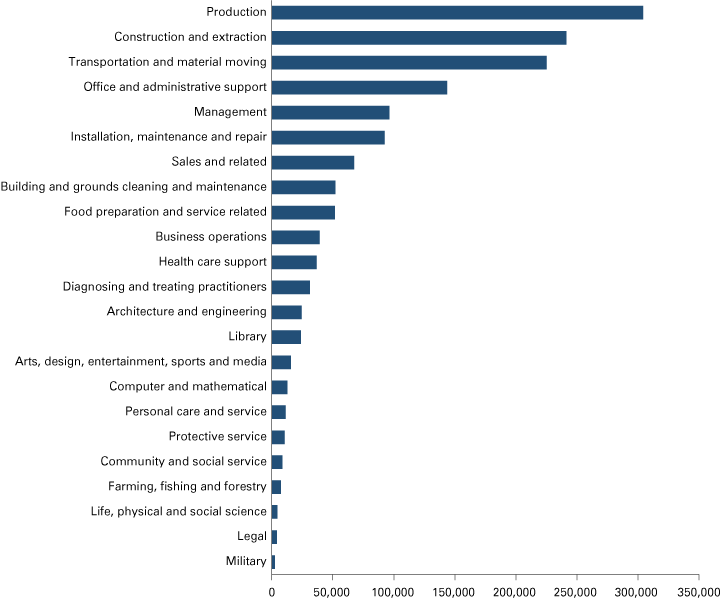
Note: There are 8,582 observations lacking occupation data.
Source: Data provided by the Indiana Department of Workforce Development, in cooperation with the Indiana Management Performance Hub (MPH)
Figure 7: Industry before unemployment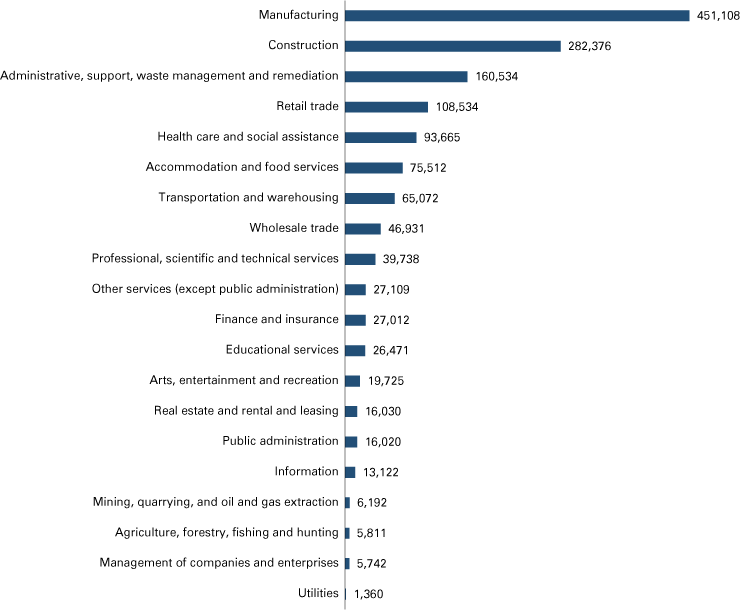
Note: There are 27,658 observations lacking industry data.
Source: Data provided by the Indiana Department of Workforce Development, in cooperation with the Indiana Management Performance Hub (MPH)
The size of firm contributing to the unemployment picture is fairly uniform (see Figure 8). The largest firms (those with 1,000 employees or more) contributed the largest number of unemployed.
Figure 8: Firm size of employer prior to unemployment
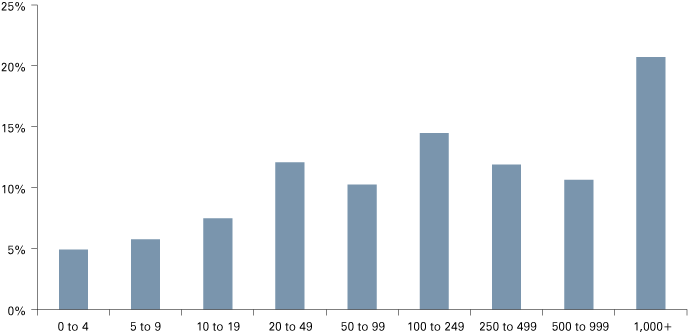
Source: Data provided by the Indiana Department of Workforce Development, in cooperation with the Indiana Management Performance Hub (MPH)
Interesting numbers are found in retention data. Of the Hoosiers collecting unemployment benefits and subsequently finding work in Indiana, 32 percent return to the very employer from which they separated. Additionally, 56 percent of claimants remain in the same industry sector.
Summary
The data indicate a diverse population of people in Indiana have benefited from unemployment benefits over the years. However, if one consistent theme remains, it is that those with more skills and higher education have done better in navigating the unemployment process. Since the labor market continues to be volatile, the only assurance one can have of success is to acquire and maintain their skills. Education and skills are still highly valued in the workplace.
