Where did they go?
Industrial change and worker transitions
Director of Economic Analysis, Indiana Business Research Center, Indiana University Kelley School of Business
The February 2016 announcement that Carrier Corporation was moving their operations from the west side of Indianapolis to Mexico angered affected workers, frustrated policymakers and surprised people in both Indiana and the nation. Many have wondered: What will become of those workers?
We can shed some light on what the future may hold for such dislocated manufacturing workers with a retrospective look at the recent past. We investigated the dynamics of change in Indiana manufacturing employment pre- and post-recession. The years between 2003 and 2014 were chosen and we focused on these questions:
- As the sector shed jobs, did the displaced workers transition to markedly different industries?
- Did they go back to school or participate in job-training programs offered by the government?
- If so, how did those actions affect their subsequent employment in Indiana?
To identify worker transitions (and as part of the Workforce Data Quality Initiative of the U.S. Department of Labor’s Employment and Training Administration), we used integrated administrative data from the Indiana Department of Workforce Development (IDWD) and the Commission for Higher Education. The resulting data set included unemployment insurance claims, quarterly industry and worker status, and degree attainment from Indiana’s public colleges and universities. A cohort of workers was created for those employed in two of Indiana’s most significant manufacturing industries—transportation equipment (TEM) and primary metals (PMM)—from 2001 through 2002 (eight quarters). The resulting cohort size of 174,865 was tracked from 2003 through 2014, and we followed changes in employment, industry and the pursuit of postsecondary public higher education.
Tracking transitions
Many of the original cohort workers continued to work in TEM and PMM between 2003 and 2014, while others switched to different manufacturing industries or to an industry outside the manufacturing sector. Some no longer appeared on an Indiana payroll. Due to the current limitations of these administrative data, we can only suggest that the latter found jobs in another state, stopped working altogether due to retirement or other factors, became self-employed, or perhaps even died.
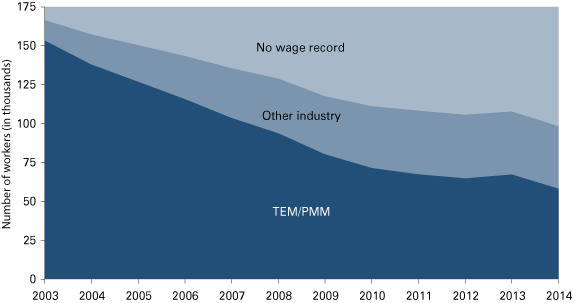
Over the span of 12 years, we can quantify that, from the original cohort of workers (174,865), 33 percent were still working in TEM or PMM by 2014. Another 23 percent had transitioned to either another manufacturing industry or another sector, and by 2014, 44 percent of the original group had no Indiana payroll record (see Figure 1).
Figure 1: Cohort employment by dominant industry
n=174,865
Note: The dominant industry is the industry in which a worker is employed for the majority of quarters in a given year. (If a person worked the same number of quarters in multiple industries, then we used the industry from the last quarter.)
Source: IBRC, using data from the Indiana Department of Workforce Development
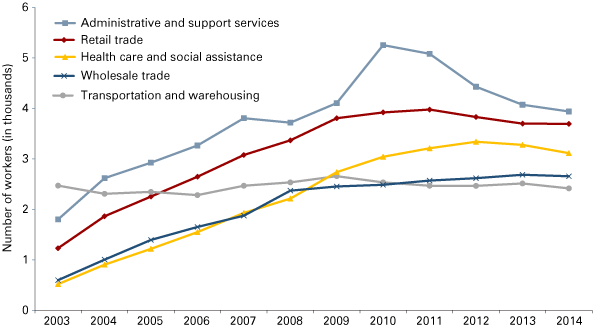
By 2014, 16 percent of the original group was working outside of the manufacturing sector. Figure 2 shows the most common sectors to which these workers transitioned, which included:
- Administrative and support services
- Retail trade
- Health care and social assistance
Figure 2: Top sectors (other than manufacturing) to which the cohort transitioned
n=174,865
Source: IBRC, using data from the Indiana Department of Workforce Development
Unemployment experience
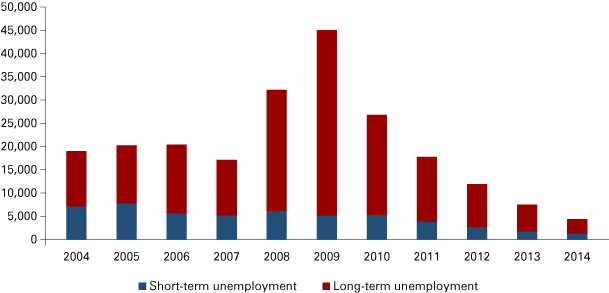
It is no surprise that unemployment among our cohort peaked during the recession (see Figure 3). In 2009, approximately 45,000 of the original TEM/PMM cohort workers received paid unemployment benefits. Over the span from 2004 to 2014, 43 percent of the cohort workers (75,729) received paid unemployment at least once. (Unemployment claims only became available in the database in 2004; thus the slight shift in the time span for unemployment experience.)
Figure 3: Cohort unemployment claimants
n=174,865
Note: Long-term unemployment is defined as receiving unemployment benefits for more than one month during the year.
Source: IBRC, using data from the Indiana Department of Workforce Development
Of the cohort workers who received unemployment benefits between 2004 and 2014, the majority indicated high school as their highest education attainment (61 percent), as shown in Figure 4.
Figure 4: Education level of cohort unemployment claimants (self-reported at time of filing for unemployment), 2004 to 2014
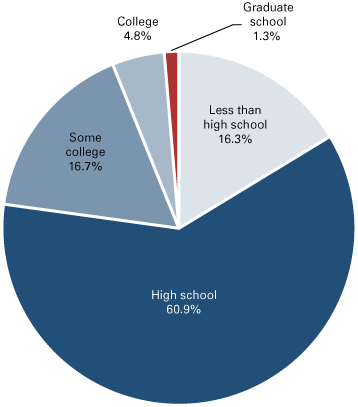
n=222,368 (this is the sum of paid unemployment filings for the cohort)
Source: IBRC, using data from the Indiana Department of Workforce Development
Job assistance programs
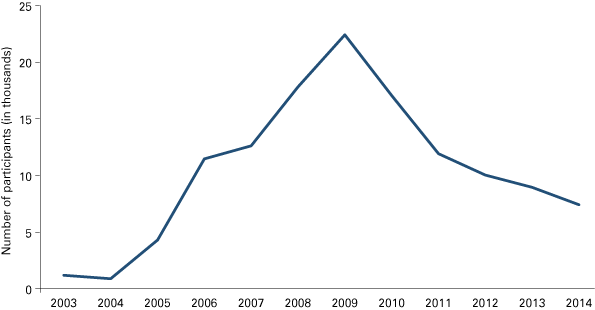
One-third of the original cohort, or 57,845 workers, enrolled in job assistance programs managed by the Indiana Department of Workforce Development. Figure 5 shows the number of cohort workers enrolled in job programs between 2003 and 2014.
Figure 5: Cohort enrollment in job assistance programs
n=174,865
Source: IBRC, using data from the Indiana Department of Workforce Development
After exiting the job assistance program(s), 57 percent returned to the manufacturing sector, while the remainder transitioned to the administrative and support, retail, or health care and social assistance sectors.
Education
Among the initial cohort of 174,865 workers in TEM/PMM, about 5,000 (3 percent) graduated from a public college or university in Indiana between 2003 and 2014.1 It bears noting that the data set included only graduation from an Indiana public institution, while some workers in the cohort may have attained certifications or degrees from private colleges, proprietary schools, colleges in other states or online.
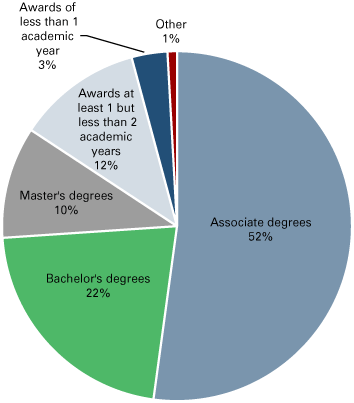
Of this group pursuing postsecondary public education, 52 percent earned an associate degree (see Figure 6).
Figure 6: Postsecondary degrees earned by the TEM & PMM cohort graduates, 2003 to 2014
n = 5,041
Source: IBRC, using data from the Indiana Commission for Higher Education
Most common fields of study? Business, health professions and engineering technologies topped the list. Both men and women pursued business-related degrees in similar numbers, but three times as many women received degrees in health professions, while engineering technology degrees were predominantly received by men.
The age profile of this group was dominated by 30-somethings (39 percent), followed by those in their 40s at 33 percent. (Note that these are the age ranges when they received their degree.) Only 9 percent of the graduates were under age 30, and these individuals were more likely to pursue degrees in engineering and computer and information sciences.
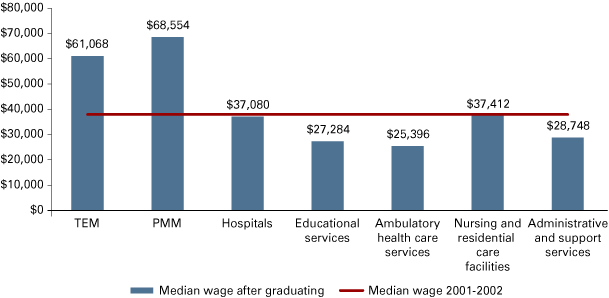
One year post-graduation, most of these workers found jobs in manufacturing, health care and social assistance, and educational services. For the graduates who returned to the manufacturing sector, half returned to TEM and a fourth to PMM. Notably for them, this was also where the highest median wages one year post-graduation were to be found (see Figure 7).2 Why transition to another industry like health care or education services when higher wages are to be had in manufacturing?
Figure 7: Annualized median wage one year after graduating for top industries
n = 5,041
Note: No adjustments were made for inflation.
Source: IBRC, using data from the Indiana Department of Workforce Development
Conclusion
By tracking a cohort of workers in these two significant Indiana manufacturing industries over 12 years, we found a strong and persistent tendency to re-enter the manufacturing sector and, in particular, the TEM and PMM originating industries of the cohort. This held true after unemployment due to layoffs or closings and even after pursuing a college degree or certificate.
With high wages, it isn’t difficult to see why workers returned to these industries, which have recovered a significant share of the jobs lost during the Great Recession. We look to conduct additional research to expand on the education component of this work and to flesh out the effect of training and college on wages. We also anticipate that as states throughout the Midwest, including Indiana, continue to pursue cross-state data sharing, that we may then be able to chart the work and education pathways more fully post-recession and post-college.
Notes
- The data set used did not include the initial enrollment date, so it is unknown whether degrees were pursued part-time or full-time.
- Wage information for the graduates includes only those who worked in one industry for three consecutive quarters out of six in the year and a half after graduating. The wages are annualized using the wages earned in the middle quarter.


