Does Export Growth Create Jobs?
Director of Economic Analysis, Indiana Business Research Center, Indiana University Kelley School of Business
That increasing exports would result in increasing employment is almost self-evident. If we—as a nation or as a state—produce more goods and services for export, then that increased production should translate into more jobs. The International Trade Administration (ITA) of the U.S. Department of Commerce touts this regularly:
The International Trade Administration is focused on job creation. Specifically, ITA works to create environments where U.S. companies can export more effectively and exporting U.S. companies can create more jobs. To support ITA’s efforts to create more American jobs, the Office of Trade Policy & Analysis assesses the impacts of various trade policies and issues on the U.S. economy and evaluates how they will affect U.S. employment.1
The ITA produces annual reports and estimates for the number of jobs that each state can attribute to its exports. The Indiana Business Research Center (IBRC) traditionally reports these estimates in our annual export report. The ITA estimation procedure is straightforward: if a state employs 3 million people in manufacturing and one-third of that manufacturing output is sold overseas as exports, then exports can be said to have created or supported 1 million jobs.
There is at least one little problem to this happy story line: the academic research does not necessarily support the claim that exports generate jobs. The savvy reader will have already noted that it is one thing to allocate jobs based on export share of manufacturing shipments (as ITA has done) and another to show the effect of exports on employment over time (as several economists have done).
For example, Leichenko (2000) found that export growth tends to contribute to employment reduction and raises the question of whether export-related increases in labor productivity may play a role. More recently, the empirical analysis of Kilkenny and Partridge (2009) agrees with similar studies that show “the relationship between the export sector employment and growth is negative” (emphasis theirs). They go even further to caution local development officials and policymakers that the export-base hypothesis—producing for markets outside the region will generate dollar inflows into the region and promote economic development—is not supported by the data (page 924).
These findings and the fact that Indiana’s exports over the last 16 years have been rising strongly, almost tripling from 1998 to 2013, motivates one to look a little deeper.
The analysis and the article are structured as follows: First, a correlation analysis at the state level compares changes in manufacturing employment with changes in exports. Even if changes in exports are not the cause of all the stresses and shocks to the manufacturing sector, one would expect to see changes in exports having some influence on manufacturing employment. (We consider manufacturing because it is the dominant exporting sector and while agricultural exports are considerable, they cannot be directly traced to any one state. There are no Indiana logos on those soybeans going to China.)
Then, we look at changes in Indiana exports and employment by industry to see if one can reach any conclusions about export growth and employment growth in the Hoosier state. Are the relationships noted in the state-by-state analysis better explained by industry dynamics?
Third, we present some rudimentary evidence that may help explain—spoiler alert—the negative relationship between export and employment growth.
Correlations
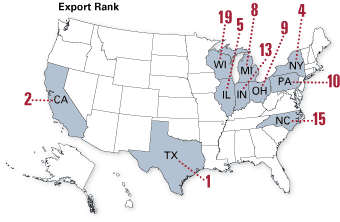
Table 1 shows the top 10 states in terms of manufacturing employment and presents the correlation between the change in exports for each state and the change in manufacturing employment. It also shows the states’ rank in terms of manufacturing export volume.
Table 1: Correlation between Growth in Exports and Growth in Manufacturing Employment for States with Greatest Number of Manufacturing Jobs
| State | Correlation, 2002 to 2013 | Manufacturing Jobs, 2013 | Export Rank, 2013 |
|---|---|---|---|
| California | -0.83 | 1,355,092 | 2 |
| Texas | -0.38 | 945,402 | 1 |
| Ohio | -0.70 | 691,317 | 9 |
| Illinois | -0.80 | 600,782 | 5 |
| Pennsylvania | -0.89 | 593,373 | 10 |
| Michigan | -0.51 | 581,113 | 8 |
| Indiana | -0.71 | 506,683 | 13 |
| New York | -0.84 | 490,939 | 4 |
| Wisconsin | -0.66 | 474,374 | 19 |
| North Carolina | -0.88 | 464,654 | 15 |
Note: Table is sorted by total manufacturing jobs.
Source: U.S. Bureau of Economic Analysis
While Washington State didn’t make the top 10 list in terms of manufacturing jobs, it ranked third in exports. Interestingly, in terms of Washington, it was only one of six states that experienced growth in manufacturing employment over the time period, and easily the largest employer of that bunch. The other states that saw the number of jobs in manufacturing increase were, in the order of the number of jobs: Utah, South Dakota, North Dakota, Alaska and Wyoming. With the exception of Utah, which had a small negative relationship of 0.01 between exports and jobs, the remaining five states were the only ones to show a positive relationship between exports and jobs.
The takeaway here appears to be that no strong case can be made to argue that export growth is fueling employment growth. In fact, considering only six states experienced job growth and export growth—and this employment growth is only “on average” because these states had an employment surge before the Great Recession that most other states did not experience—one cannot say that exports had much, if any, influence on manufacturing employment.
Indiana Export Industries
Indiana’s manufacturing performance in terms of employment and exports from 2002 to 2013 is shown in Table 2. As with the state-level data, there are few cases for which employment and exports are positively related. With the exception of food processing, the industries showing a positive relationship between exports and employment are relatively small. And while miscellaneous manufacturing (which includes medical devices) may not be small in terms of employment or the value of exports, the positive relationship is weak.
Table 2 also shows the average change in employment and exports over the time period. In just about every three-digit industry, employment has declined over the last dozen years. Even miscellaneous manufacturing could only muster an imperceptible 0.01 percent increase in employment at an average annual rate (AAR)—even while exports from this industry increased on average 11 percent a year.
Table 2: Employment and Export Performance, Indiana Manufacturing, 2002 to 2013
| NAICS Code | NAICS Title | Correlation | Average Employment | 2013 Exports ($ millions) | Average Annual Change in Employment | Average Annual Export Growth |
|---|---|---|---|---|---|---|
| 311 | Food Manufacturing | 0.95 | 32,701 | 966 | 0.8% | 13.7% |
| 324 | Petroleum and Coal Products Manufacturing | 0.84 | 3,357 | 175 | 0.7% | 21.2% |
| 313 | Textile Mills | 0.63 | 574 | 51 | 1.0% | 6.9% |
| 316 | Leather and Allied Product Manufacturing | 0.43 | 660 | 12 | 5.4% | 0.8% |
| 312 | Beverage and Tobacco Product Manufacturing | 0.39 | 3,755 | 96 | 1.0% | 12.2% |
| 339 | Miscellaneous Manufacturing | 0.06 | 29,196 | 2,067 | 0.1% | 11.3% |
| 321 | Wood Product Manufacturing | -0.24 | 16,300 | 183 | -4.8% | 3.3% |
| 332 | Fabricated Metal Product Manufacturing | -0.25 | 56,340 | 965 | -1.3% | 6.1% |
| 314 | Textile Product Mills | -0.27 | 3,115 | 27 | -0.9% | 7.4% |
| 333 | Machinery Manufacturing | -0.36 | 42,502 | 4,109 | -1.6% | 5.1% |
| 327 | Nonmetallic Mineral Product Manufacturing | -0.37 | 13,980 | 273 | -2.5% | 4.7% |
| 336 | Transportation Equipment Manufacturing | -0.39 | 121,045 | 9,763 | -2.1% | 6.4% |
| 326 | Plastics and Rubber Products Manufacturing | -0.41 | 39,537 | 837 | -2.3% | 4.8% |
| 334 | Computer and Electronic Product Manufacturing | -0.54 | 20,199 | 1,908 | -3.9% | 2.0% |
| 315 | Apparel Manufacturing | -0.72 | 1,185 | 23 | -5.8% | 15.9% |
| 323 | Printing and Related Support Activities | -0.72 | 18,369 | 271 | -2.7% | 6.6% |
| 335 | Electrical Equipment, Appliance, and Component Manufacturing | -0.78 | 11,735 | 1,099 | -7.2% | 7.1% |
| 331 | Primary Metal Manufacturing | -0.81 | 46,567 | 1,590 | -2.9% | 10.1% |
| 325 | Chemical Manufacturing | -0.85 | 30,743 | 8,916 | -1.1% | 11.8% |
| 322 | Paper Manufacturing | -0.86 | 11,082 | 162 | -2.4% | 4.4% |
| 337 | Furniture and Related Product Manufacturing | -0.97 | 24,597 | 193 | -2.5% | 10.3% |
Source: Quarterly Census of Employment and Wages, Indiana Department of Workforce Development and WISERTrade
The state-by-state comparisons in Table 1 together with the industry detailed correlation analysis corroborates with other academic findings that, on balance, there is a negative relationship between employment and exports (despite this relationship running contrary to one’s intuition and the U.S. Department of Commerce’s press releases). What can account for this?
Leichenko (2000) suggested that increases in labor productivity in exporting industries may play a role. While the following presentation won’t pass academic muster, it does suggest that productivity growth appears to explain these relationships.
A Brief Excursus on Productivity
The word productivity sounds good. It has a nice ring. When someone reflects about her day and says that it was productive, she usually has a contented smile. She got a lot done.
Measuring productivity in economics is usually focused on labor, that is, how much labor and how much output. Increasing labor productivity means each unit of labor, measured in terms of hours or work or number of workers, is producing more.
A critical measure in analyzing productivity is value added. Value added is a payment or income to someone engaged in production either directly or indirectly—labor, profits, patent holders, royalties and interest—and the greater the value added per worker, the more income there is to share among capital, labor, patent holders, etc.
As a ballpark measure of value added for an industry, we use data from the Annual Survey of Manufactures (ASM) from the U.S. Census Bureau. The ASM “value added” is not the value added used in the national economic accounts (discussed above) so it needs some adjustments. The net measure of “adjusted” Census value added approximates income to labor, capital, intellectual property holders, physical property holders (like rental units or mineral owners) and interest that is used in the national economic accounts and used to measure labor productivity.
The ASM data series is not as complete as the data captured from the U.S. Bureau of Economic Analysis or WISERTrade. The data from the annual survey are often suppressed for several industries, making it difficult to explore industry dynamics over time. Moreover, in this instance, the time series are abbreviated compared to employment or export data. That said, the ASM adjusted value-added data do seem to show some interesting relationships.
Exports, Employment and Labor Productivity
The evidence over the last dozen years in terms of manufacturing employment and export growth appears to confirm Leichenko’s suspicion: increases in productivity can help explain the negative relationship between export growth and employment.
Using the productivity data derived from the ASM together with the employment and export data, we plotted the trends for six industries of interest. These industries are large employers, provide some contrast in terms of correlations and have complete or almost complete productivity data.
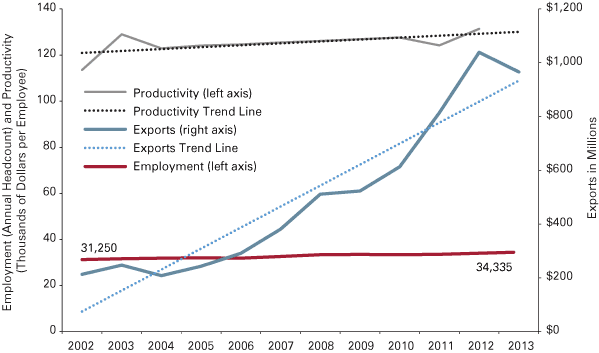
Figure 1 presents the case of food manufacturing, the only industry of significant size to show a strong and positive correlation between employment and exports. Even with a correlation of 0.95, we see exports rising considerably faster than employment, but at least both are on the upswing. In contrast, productivity growth in the industry is relatively flat.
Figure 1: Food Manufacturing Employment, Export and Productivity Trends
Source: Quarterly Census of Employment and Wages (employment), WISERTrade (exports) and U.S. Census Bureau (productivity)
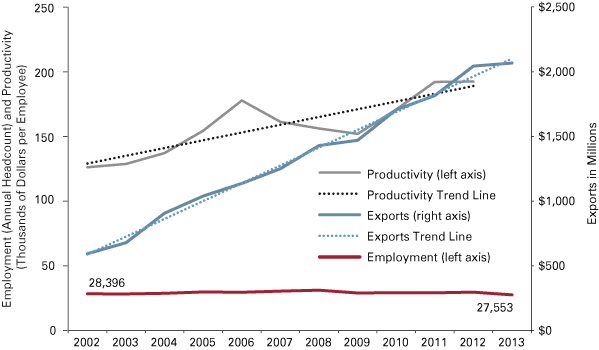
Figure 2 presents the relationship of employment, exports and productivity for miscellaneous manufacturing. The positive relationship between employment and exports is weak for this industry. For all intents and purposes, employment in the industry was unchanged from the beginning to the end of the time period, although the correlation statistic does register fluctuations in the two series over time. Exports rose robustly by more than 11 percent (AAR) and productivity followed suit, but at a slower 4 percent rate (AAR).
Figure 2: Miscellaneous Manufacturing Employment, Export and Productivity Trends
Note: Miscellaneous manufacturing includes medical device manufacturing.
Source: Quarterly Census of Employment and Wages (employment), WISERTrade (exports) and U.S. Census Bureau (productivity)
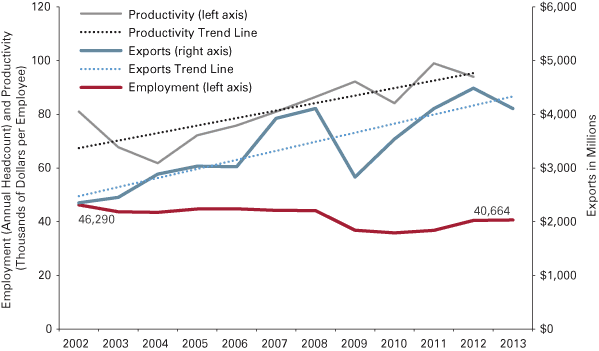
Figure 3 plots machinery manufacturing. Here one begins to see the divergence between employment trends and export growth. Employment declined nearly 6,000 workers over the time period (AAR of 0.3 percent) while exports grew by over 5 percent yearly (AAR). Since the mid-2000s, there is a consistent upward trend in productivity, the recessionary down-tick notwithstanding.
Figure 3: Machinery Manufacturing Employment, Export and Productivity Trends
Source: Quarterly Census of Employment and Wages (employment), WISERTrade (exports) and U.S. Census Bureau (productivity)
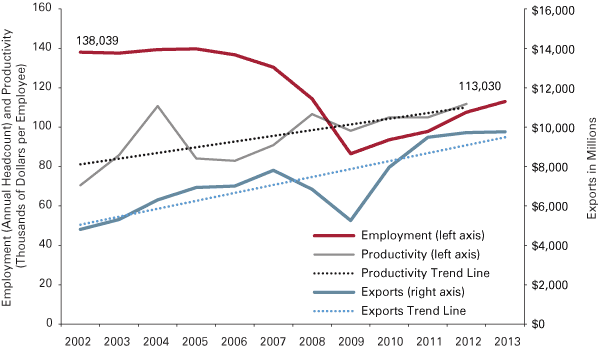
Figure 4 shows the Indiana industrial powerhouse of transportation equipment manufacturing (TEM). As with many manufacturing industries, TEM has seen employment fall over time (about 2 percent a year AAR), with particularly dramatic employment cuts during the Great Recession. Despite the dip in exports during the recession, the overall trend in exports shows a respectable rise of about 6 percent a year (AAR) over the entire period. As it happens, over the (truncated) period, productivity grew at about 5 percent a year (AAR).
Figure 4: Transportation Equipment Manufacturing Employment, Export and Productivity Trends
Source: Quarterly Census of Employment and Wages (employment), WISERTrade (exports) and U.S. Census Bureau (productivity)
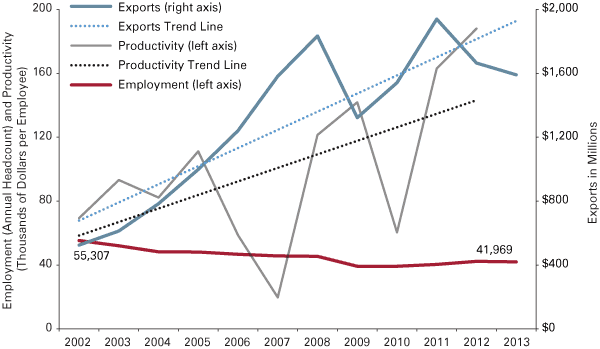
Figure 5 plots Indiana’s primary metal manufacturing employment, export and productivity changes. Both exports and productivity were a bit choppy over the time period, but the overall trend was up for both, increasing on an annual average rate of about 10 percent. Meanwhile, employment dropped over 13,000, an average annual rate of -2.5 percent. This helps to explain a distinctively negative relationship between employment and exports observed with the correlation coefficient.
Figure 5: Primary Metal Manufacturing Employment, Export and Productivity Trends
Source: Quarterly Census of Employment and Wages (employment), WISERTrade (exports) and U.S. Census Bureau (productivity)
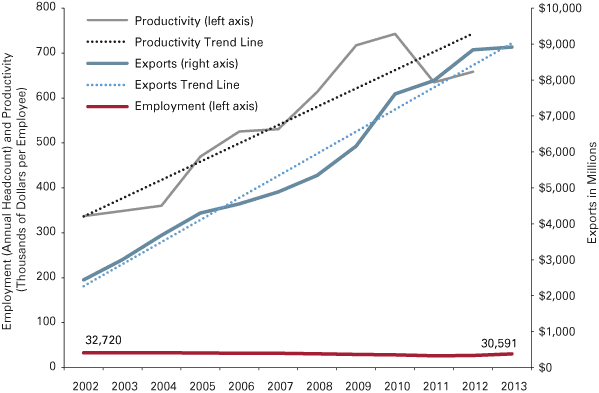
Figure 6 visually describes the chemical industry from 2002 to 2013 for employment, exports and productivity. Employment dropped some 2,000 jobs. More detailed industry data show that pharmaceutical exports grew quickly, bringing the aggregated chemical industry annual average rate of export growth to over 11 percent.
Figure 6: Chemical Manufacturing Employment, Export and Productivity Trends
Note: Chemical manufacturing includes pharmaceuticals.
Source: Quarterly Census of Employment and Wages (employment), WISERTrade (exports) and U.S. Census Bureau (productivity)
The alert reader will have noted that the scale of the left axis is considerably larger for chemicals than for say food or transportation manufacturing. This reflects that components of value added per employee are much larger than in other industries. In the case of chemicals, or pharmaceuticals more specifically, there is a lot more intellectual content embodied in production of specialized drugs than, say, car parts. As a result, the productivity measure—value added per worker—not only pays the wages and salaries of the employees as well as the earnings for shareholders, it also pays the royalties on patents and returns to investment on research and development that created those very special molecules.
Conclusion
So what to make out of all this? First, we will have to accept that increasing exports will not necessarily translate into new jobs. The opposite may not be true, however. If a strengthening dollar results in reduced or negative export growth, employment in those industries may fall.
Second, it is difficult to accept the export base strategy for economic development and regional prosperity as a viable approach. There isn’t much empirical evidence to support this approach. That said, the negative relationship between exports and employment for most industries, at least most industries in Indiana and most states, may say something about the nature of U.S. exports. That is, the U.S. exports manufactured goods that are specialized, differentiated and have a high level of intellectual content. In short, these are goods that are not generic commodities but ones that have higher value per unit and, thus, higher value added, all other things equal. Only additional analysis would be able to determine if this is indeed the case. That analysis would likely have to differentiate the flow of goods between NAFTA partners—there is a lot of export and re-importation of parts in the auto industry, for example—with those in advanced and developing countries.
It would also be illuminating to determine the degree to which exports from the U.S. are sensitive to the scale (or volume) of production. One way to think about the sensitivity to scale is to contrast one additional sales unit of a video game versus a bicycle. The additional unit of a video game is pennies—one could sell millions of copies without needing a single additional worker. In contrast, a physical bicycle requires several people to form and assemble all the parts that make up a bicycle. One cannot produce and sell a million mountain bikes without hiring a lot of additional workers.
Finally, without accepting the mantra of the U.S. Commerce Department, we may still believe that expanding exports is desirable. The manufacturing sector lost jobs in the U.S. and in Indiana, even while exports were expanding robustly. But imagine how bad the employment picture may have been if exports were not expanding. Export growth may not greatly expand employment opportunities, but it likely beats the alternative.
Notes
- “Employment and Trade,” International Trade Administration, www.trade.gov/mas/ian/employment/.
References
- Leichenko, Robin M. “Exports, Employment, and Production: A Causal Assessment of U.S. States and Regions.” Economic Geography 76, no. 4 (2000): 303-325.
- Kilkenny, Maureen, and Mark D. Partridge. “Export Sectors and Rural Development.” American Journal of Agricultural Economics 91, no. 4 (2009): 910-929.
Also in this Issue…


