South Bend and Elkhart Area Forecast 2016
Director, Bureau of Business and Economic Research, Chair and Associate Professor of Economics, Judd Leighton School of Business and Economics, Indiana University South Bend
The South Bend-Mishawaka Metropolitan Statistical Area (MSA) and Elkhart-Goshen MSA saw moderate economic growth in 2015, a small expansion in the labor force, increased employment, lower unemployment rates, a slight growth in wages and continuous recovery in the housing market.
Real Metropolitan GDP
The combined size of the local economy grew moderately in 2015. The combined South Bend-Mishawaka MSA and Elkhart-Goshen MSA economy, as measured by its real metropolitan gross domestic product (RGDP), was $617 million higher in 2014 than in 2013, an increase of 2.6 percent.1 Compared to its historic low in 2009, the combined production level of the two MSAs gained $4.611 billion, but it was still $17 million below 2007’s prerecession level.
Specifically, the Elkhart-Goshen MSA saw a faster economic growth of 5 percent in 2014, gaining $533 million in RGDP; meanwhile, the South Bend-Mishawaka MSA grew only 0.7 percent in its aggregate production, adding an additional $84 million. The Elkhart MSA’s RGDP was $534 million above the 2007 prerecession level; however, the South Bend-Mishawaka MSA’s RGDP was $551 million below its 2007 level.
Labor Force and Employment
The local economy’s labor force exhibited staggering growth from August 2014 to August 2015, gaining 4,521 workers (see Figure 1).2 In August 2015, the combined labor force was 258,435 workers—14,520 workers smaller than its historic high in July 2006 and 1,546 workers lower than its August 2007 prerecession level.
Figure 1: Labor Force and Employment in the Elkhart-Goshen and South Bend-Mishawaka MSAs Combined, January 1990 to August 2015
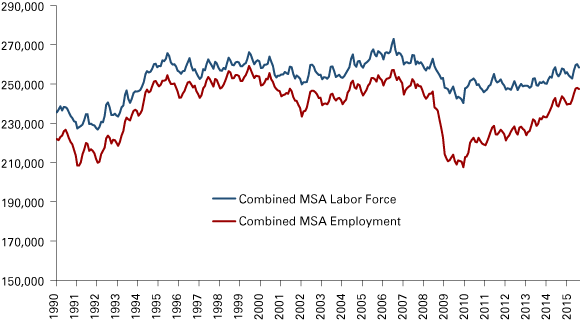
Note: Data are not seasonally adjusted.
Source: STATS Indiana, using U.S. Bureau of Labor Statistics data
The recovery in the labor market in the two MSAs from August 2014 to August 2015 was still occurring at a good pace: Total employment for the combined region increased from 238,503 workers to 247,531 workers. In particular, the Elkhart-Goshen MSA added 4,811 jobs and employment in the South Bend-Mishawaka MSA gained 4,207 workers during the same time period. The growth rates of employment in the Elkhart-Goshen and South Bend-Mishawaka MSAs were 4.9 percent and 3.0 percent, respectively—both of which outperformed the U.S. (1.8 percent) and Indiana (2.8 percent).
Unemployment
The unemployment rates in both MSAs experienced noticeable improvements from August 2014 to August 2015. In particular, the jobless rate in the Elkhart-Goshen MSA was 3.6 percent in August 2015, down from 5.1 percent in August 2014. The South Bend-Mishawaka MSA’s unemployment rate declined from 6.7 percent in August 2014 to 4.7 percent in August 2015. In both areas, the unemployment rate was below the prerecession August 2007 rate.
Figure 2 shows that these rates for August 2015 were much lower than they were during the same month in 2009, and were an improvement relative to August 2014. In particular, the Elkhart-Goshen MSA outperformed the U.S. and Indiana averages between 2014 and 2015. (The national average unemployment rate declined from 6.3 percent in August 2014 to 5.2 percent in August 2015, while the state average unemployment rate dropped from 6 percent to 4.4 percent during the same time period.)
Figure 2: Unemployment Rate in the Elkhart-Goshen and South Bend-Mishawaka MSAs, January 1990 to August 2015
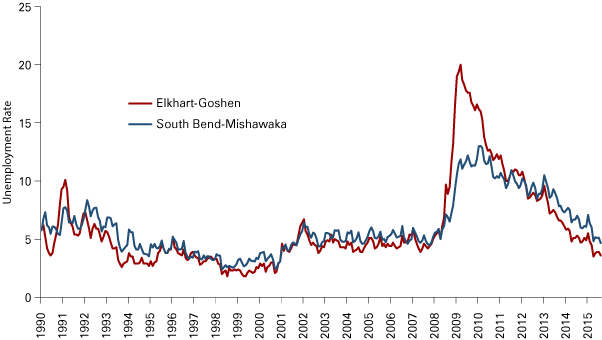
Note: Data are not seasonally adjusted.
Source: STATS Indiana, using U.S. Bureau of Labor Statistics data
Employment by Industry
Table 1 displays employment by industry and by metro area in August 2015, along with change since August 2014. As of August 2015, 265,500 people were employed in the nonfarm sectors across the region. The year-over-year comparison on employment data from the U.S. Bureau of Labor Statistics indicates smaller job growth for the local economy in 2015 than in 2014. For example, the nonfarm sectors in both metro areas added 8,200 new jobs in total from August 2014 to August 2015, while the gain was 9,400 jobs from August 2013 to August 2014.
Table 1: Employment by Industry and Metro Area, August 2015
| Elkhart-Goshen | South Bend-Mishawaka | Combined MSAs | ||||
|---|---|---|---|---|---|---|
| Industry | Employment | Change since August 2014 | Employment | Change since August 2014 | Employment | Change since August 2014 |
| Total Nonfarm | 130,300 | 5,600 | 135,200 | 2,600 | 265,500 | 8,200 |
| Natural Resources, Mining and Construction | 2,900 | -300 | 4,400 | -400 | 7,300 | -700 |
| Manufacturing | 62,300 | 3,900 | 17,600 | 600 | 79,900 | 4,500 |
| Trade, Transportation and Utilities | 19,700 | 600 | 25,000 | 0 | 44,700 | 600 |
| Information | 600 | 0 | 1,800 | 0 | 2,400 | 0 |
| Financial Activities | 2,600 | -100 | 5,200 | -200 | 7,800 | -300 |
| Professional and Business Services | 10,500 | 200 | 13,300 | 500 | 23,800 | 700 |
| Private Educational and Health Services | 11,600 | 600 | 34,500 | 2,600 | 46,100 | 3,200 |
| Leisure and Hospitality | 7,900 | 500 | 13,400 | -200 | 21,300 | 300 |
| Other Services | 3,700 | 0 | 6,300 | 400 | 10,000 | 400 |
| Government (Includes Public Schools and Hospitals) | 8,500 | 200 | 13,700 | -700 | 22,200 | -500 |
Source: STATS Indiana, using U.S. Bureau of Labor Statistics Current Employment Statistics data
The following industries experienced job growth during the past year in the combined MSAs: manufacturing; private educational and health services; trade, transportation and utilities; professional and business services; leisure and hospitality; and other services. Since August 2014, the biggest job loss for the combined area occurred in natural resources, mining and construction (-700 jobs). Government and financial activities lost 500 and 300 jobs, respectively, while employment in the information sector stayed unchanged.
The Elkhart-Goshen area surpassed the South Bend-Mishawaka MSA in job creation, adding 5,600 new jobs (a 4.5 percent increase) in the nonfarm sector from August 2014 to in August 2015. For sector details, in the Elkhart-Goshen area, manufacturing once again was the major driving force of job growth, gaining 3,900 jobs over the last year and accounting for 70 percent of the job increase in this area. Other sectors that experienced job growth in the Elkhart-Goshen MSA included trade, transportation and utilities (+600 jobs); private educational and health services (+600 jobs); leisure and hospitality (+500 jobs); professional and business services (+200 jobs); and government (+200 jobs).
Meanwhile, total nonfarm employment increased 2.0 percent (+2,600 jobs) in the South Bend-Mishawaka MSA between August 2014 and August 2015. Unlike the Elkhart-Goshen picture, the most job growth in the South Bend-Mishawaka MSA was observed in the service-producing industries. For example, private education and health services added 2,600 jobs; professional and business services created 500 jobs; and other services generated 400 new jobs over the last year. The job addition in manufacturing was 600. However, the job losses in other sectors—including government (-700 jobs), natural resources, mining and construction (-400 jobs), financial activities (-200 jobs), and leisure and hospitality (-200 jobs)—counteracted the recovery in South Bend-Mishawaka’s labor market.
Local Wages and Hours Worked
Changes in average weekly wages were mixed over the last year. The average weekly wage of $744 in the Elkhart-Goshen MSA was 1.5 percent higher than the same month in 2014, while the South Bend-Mishawaka MSA’s average weekly wage of $786 decreased 0.6 percent over the same time period. From August 2014 to August 2015, average weekly hours declined 3.2 percent to 36 hours in the Elkhart-Goshen MSA; whereas, the average weekly hours gained 2.6 percent to 35.1 hours in the South Bend-Mishawaka area. Overall, income is forecasted to grow in both MSAs in 2016.
Housing
Residential construction, measured by the number of single-family building permits issued in St. Joseph County, rebounded strongly in 2015 (current data for Cass and Elkhart counties are not available). From January 2015 to August 2015, 110 permits were issued—more than two times the new home permits issued during the same time period in 2014 (see Figure 3). However, the housing market in St. Joseph County has not fully recovered to its prerecession level, considering that 368 permits were issued in the first eight months in 2005.
Figure 3: Single-Family Residential Building Permits in St. Joseph County, January 2005 to August 2015
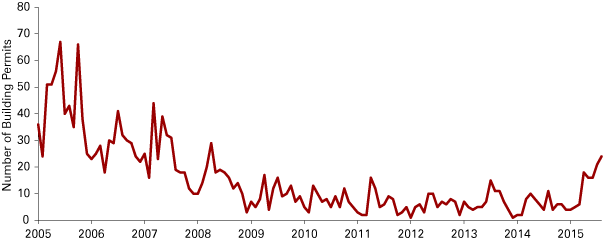
Source: St. Joseph County Building Department
Recent housing market data released by the Indiana Association of Realtors indicate positive signs in the local housing market.3 The year-over-year inventory of homes for sale fell 11.6 percent. New listings and closed sales increased 2 percent and 12 percent, respectively. The year-to-date data showed that median sales price climbed 4.3 percent in 2015. Overall, these statistics suggest a more active housing market in St. Joseph County.
Forecast
With the economy continuing to grow moderately in the U.S., strong consumer and business spending will fuel the local economy in the Elkhart-Goshen and South Bend-Mishawaka MSAs. Real metropolitan GDP is expected to grow in the upcoming year in both areas, with larger growth forecasted for the Elkhart-Goshen MSA.
Employment will increase in both areas in 2016, with Elkhart-Goshen exhibiting faster job growth due to the lion’s share of manufacturing activities in the local economy. More people are expected to join the labor force in both areas. Unemployment rates will remain steady, ticking down at most 1-2 percentage points in 2016 because the unemployment rates are very close to 10-year lows.4
Income growth is forecasted in both MSAs in 2016, with Elkhart-Goshen again gaining more than South Bend-Mishawaka. Gains in employment and income provide the foundation for continued improvement in the housing market.
Sales of existing homes are expected to increase at a steady pace and median sales price will continue to go up. It is a popular anticipation that the Federal Reserve will raise short-term interest rates at the end of 2015, and the rise in interest rates will continue throughout 2016. Though higher interest rates may cool down the housing market to a certain extent in the future, the slow hikes in interest rates may in turn motivate more housing activities because potential buyers would start looking before rates go up more.
Notes
- In 2014, real metropolitan GDP in Elkhart-Goshen and South Bend-Mishawaka was $24.419 billion, according to the U.S. Bureau of Economic Analysis.
- Access these labor force and employment data on STATS Indiana at www.stats.indiana.edu/laus/laus_view3.html.
- Indiana Association of Realtors, “Indiana Housing Market Update,” August 2015.
- In South Bend-Mishawaka, the lowest unemployment rate between August 2005 and August 2015 was 4.5 percent. In Elkhart-Goshen, the 10-year low unemployment rate was 3.5 percent over the same time period.