Richmond Forecast 2016
Assistant Professor of Economics and Finance and Director of the Business and Economic Research Center, School of Business and Economics, Indiana University East
The Richmond area1 economy continued to march forward throughout 2015. The labor market gained steam, and the unemployment rate was back down to prerecession levels. Job openings were modestly seen in major industries. The housing market steadily inched up. Wage growth appeared to be stronger in some industries. The forecast for 2016 is favorable, but there are headwinds from the national and international economies that can set back the regional economy.
Income
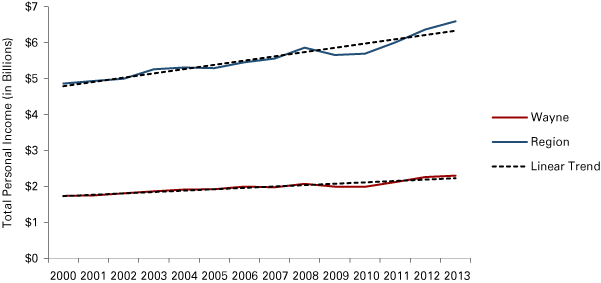
Total personal income (TPI) fell significantly in Wayne County and East-Central Indiana during the Great Recession. Good news: Total income levels in the region have bounced back. The most recent data at the time of this writing show that TPI now exceeds the long-run trend (see Figure 1).
Figure 1: Wayne County and East-Central Indiana Total Personal Income
Source: U.S. Bureau of Economic Analysis Regional Fact Sheets
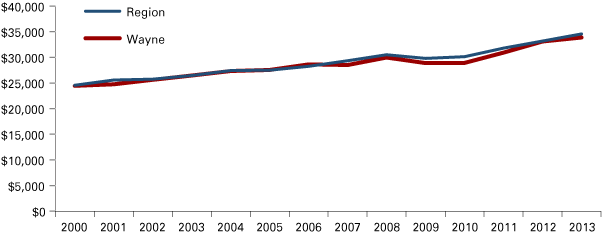
Accordingly, per capita personal income (PCPI) also grew since 2010 (see Figure 2).
Figure 2: Wayne County and East-Central Indiana Per Capita Personal Income
Source: U.S. Bureau of Economic Analysis Regional Fact Sheets and STATS Indiana
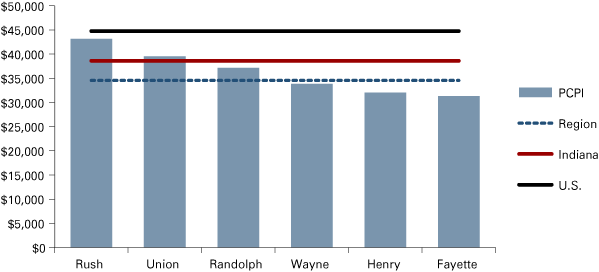
Figure 3 shows the latest 2013 PCPI values across the region. Rush County ($43,167) led the region, followed by Union ($39,553) and Randolph ($37,161) counties. These three counties’ PCPIs were above the region’s average ($34,567), but only Rush and Union counties’ PCPIs surpassed the state average ($38,622). No county’s PCPI in this region matched the national level ($44,765). TPI and PCPI are important indexes for measuring the overall economic activities and personal disposable income, although the data has a two-year lag period. Since the economy in our region has experienced steady economic growth in 2014 and 2015, TPI and PCPI are expected to have continued advancing.
Figure 3: County-Level PCPI, 2013
Source: U.S. Bureau of Economic Analysis Regional Fact Sheets and STATS Indiana
Labor Market
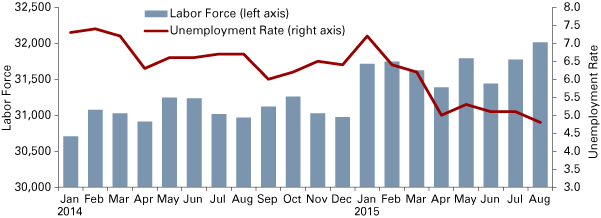
The labor force and unemployment rate changes in Wayne County are striking (see Figure 4). The average labor force in the first eight months of 2015 is 600 more than it was during the same period of 2014. The unemployment rate continuously keeps heading south and has reached prerecession levels. The August rate (the most current data at the time of this writing) surprisingly dipped to 4.8 percent, beating the national rate of 5.2 percent. This was the lowest level in the past seven years.
Figure 4: Wayne County’s Labor Force and Unemployment Rate
Note: Data are not seasonally adjusted.
Source: Indiana Department of Workforce Development, Local Area Unemployment Statistics
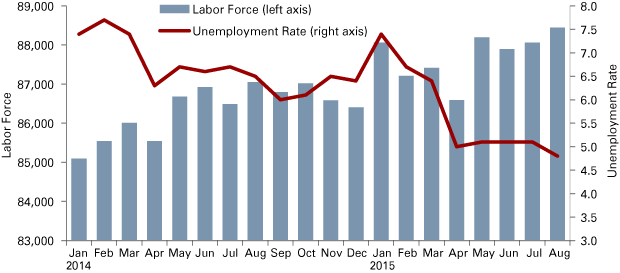
The region’s labor market picture mirrors Wayne County’s (see Figure 5). On average, the labor force expanded by nearly 1,600 people from January to August 2015 relative to one year ago, accompanied by a downward unemployment rate. No doubt, the achievements on labor force and unemployment are remarkable for Wayne County and the region so far this year.
Figure 5: Region’s Labor Force and Unemployment Rate
Note: Data are not seasonally adjusted.
Source: Indiana Department of Workforce Development, Local Area Unemployment Statistics
Employment and Wages
Increased employment in major industry sectors is more evidence of improving economic conditions. Compared to a year ago, Wayne County gained 164 nonfarm jobs in the first quarter. The major job gainers were professional and business services (110 jobs) and private educational and health services (180 jobs). Manufacturing, the key industry in this region, experienced mild job growth by adding 40 jobs. However, the trade (retail and wholesale), transportation and utilities sector had nearly 300 job losses, which were largely due to the retail store closures in the Richmond Square Mall. Other job losses also appeared in information and other services sectors.
Table 1: Employment by Industry
| Wayne County | Region | |||
|---|---|---|---|---|
| 2015 Q1 | One-Year Change | 2015 Q1 | One-Year Change | |
| Total Nonfarm | 29,555 | 164 | 61,753 | 510 |
| Total Private | 25,077 | 135 | 50,362 | 475 |
| Goods-Producing | 6,364 | 108 | 14,624 | 226 |
| Manufacturing | 5,512 | 40 | 12,130 | 135 |
| Private Service-Providing | 18,713 | 26 | 35,736 | 245 |
| Trade, Transportation and Utilities | 5,447 | -293 | 11,098 | -197 |
| Information | 224 | -15 | 553 | -8 |
| Financial Activities | 1,054 | 25 | 2,082 | 75 |
| Professional and Business Services | 2,416 | 110 | 4,505 | -13 |
| Private Educational and Health Services | 5,880 | 180 | 10,408 | 185 |
| Leisure and Hospitality | 3,085 | 43 | 5,681 | 209 |
| Other Services | 607 | -25 | 1,410 | -8 |
| Government | 4,478 | 29 | 11,391 | 35 |
Note: Some data for Union County are not disclosed.
Source: U.S. Bureau of Labor Statistics, Quarterly Census of Employment and Wages
Similarly, the region realized 510 new jobs, mostly in leisure and hospitality (209 jobs) and private educational and health services (185 jobs). The job losses in trade, transportation and utilities, information and other services in Wayne County also influenced the loss of jobs in these sectors for the whole region. The region also bears a slight job loss in the professional and business services sector. Though it is cheerful to see steady net job gains in this area, the pace of job growth is stunningly slow, compared to more than 900 job gains in Wayne County and nearly 1,500 in the region as stated in last year’s outlook.
The wage growth is still lull in general, but there are a few exceptions (see Table 2). Total nonfarm average weekly wages only had a negligible 0.1 percent increase ($2) in Wayne County vs. a 1.5 percent ($7) increase in the region. The largest payroll hikes were seen in financial activities (5.3 percent) in Wayne County and in private educational and health services in the region (7.8 percent). Solid wage growth can also be found in information and other services (4.7 percent and 4.6 percent, respectively) in Wayne County, and in other services (4.8 percent), financial activities (3.8 percent) and manufacturing (3.7 percent) in the region.
Table 2: Average Weekly Wages
| Wayne County | Region | |||
|---|---|---|---|---|
| 2015 Q1 | One-Year Change | 2015 Q1 | One-Year Change | |
| Total Nonfarm | $668 | 0.1% | $643 | 1.5% |
| Total Private | $669 | 0.5% | $647 | 3.4% |
| Goods-Producing | $853 | 1.5% | $871 | 3.0% |
| Manufacturing | $882 | 1.7% | $916 | 3.7% |
| Private Service-Providing | $607 | 0.0% | $537 | 2.9% |
| Trade, Transportation and Utilities | $573 | 1.8% | $567 | 1.4% |
| Information | $697 | 4.7% | $613 | 3.4% |
| Financial Activities | $876 | 5.3% | $736 | 3.8% |
| Professional and Business Services | $685 | -10.2% | $580 | 1.9% |
| Private Educational and Health Services | $757 | 0.9% | $595 | 7.8% |
| Leisure and Hospitality | $259 | -2.6% | $246 | 1.9% |
| Other Services | $428 | 4.6% | $445 | 4.8% |
| Government | $850 | 0.8% | $761 | -2.7% |
Note: Some data for Union County are not disclosed.
Source: U.S. Bureau of Labor Statistics, Quarterly Census of Employment and Wages
Unfortunately, employees in a few sectors still suffered a pay cut. For example, in Wayne County, the average wages for professional and business services employees slipped more than 10 percent relative to a year ago, and the leisure and hospitality workers’ take-home paycheck was 2.6 percent smaller than in the same period of 2014. Looking at the regional level, only the government sector had slimmer wages in 2015.
Housing
The sale of single-family houses inched up in 2015. As illustrated in Table 3, closed sales in the first eight months of 2015 were up 1.6 percent in Wayne County and 2.1 percent in the region relative to the same period of 2014. Only Henry and Rush counties had a paltry drop in the number of sales. The changes in median sales prices varied across the region. The region’s median sales price (excluding Rush County) was up 18 percent, compared to a 6.3 percent increase for Indiana. The median price in Randolph and Wayne had a robust rebound, 34.7 percent and 13.1 percent, respectively. Henry County grew at a moderate rate of 3.6 percent, while Fayette County's median price remained unchanged. The prices in Rush and Union tumbled significantly, likely due to the particular mix of homes that sold.
Table 3: Year-to-Date Housing Market Update
| Closed Sales | Median Price | |||||
|---|---|---|---|---|---|---|
| 2014 | 2015 | Percent Change | 2014 | 2015 | Percent Change | |
| Statewide | 49,794 | 54,227 | 8.9% | $126,000 | $134,000 | 6.3% |
| Region* | 942 | 962 | 2.1% | $68,000 | $79,900 | 18.0% |
| Fayette | 100 | 109 | 9.0% | $58,500 | $58,500 | 0.0% |
| Henry | 233 | 230 | -1.3% | $67,500 | $69,900 | 3.6% |
| Randolph | 100 | 105 | 5.0% | $49,000 | $66,000 | 34.7% |
| Rush | 9 | 8 | -11.1% | $42,000 | $34,500 | -17.9% |
| Union | 9 | 11 | 22.2% | $85,000 | $52,250 | -38.5% |
| Wayne | 491 | 499 | 1.6% | $72,500 | $82,000 | 13.1% |
* The regional median price data excludes Rush County.
Note: Year-to-date data reflect January through August data.
Source: Indiana Real Estate Market Report by Indiana Association of Realtors, except Wayne County’s data and the regional median price data, which was provided by Better Homes and Gardens/First Realty Group
Business/Investment Activity
In 2015, the Economic Development Corporation (EDC) of Wayne County did an excellent job partnering with 11 existing companies to expand their production lines, as well as attracting a new company to locate to Wayne County. The total new capital investment was $27.59 million. Those projects retained 98 jobs and are intended to create 232 new jobs. The average wage per new or retained job was $42,102. The following list highlights new projects invested in by the EDC through 2015:
- Osborn International moved its North American headquarters to Richmond. This move is projected to create 35 new jobs. The company will construct a 7,400-square-foot addition to its existing facility.
- Janesville Acoustics announced a manufacturing plant in Richmond, creating up to 87 new jobs by 2016.
- JM Hutton and Company, Inc. expanded its product line with new equipment purchases. As a result of the project, five new jobs were created with an average wage of $17.75 per hour.
- Noble Order Brewing Co. planned to add 10 new jobs and invest over $570,000.
- Woodruff Corporation purchased a new water jet cutting line. It planned to invest over $400,000 and create six new jobs.
- Suncall America, Inc. planned to purchase equipment to expand its product line and add 10,000 square feet to accommodate the new machinery.
- Ahaus Tool and Engineering, Inc. expanded its assembly area. The project resulted in close to $700,000 in investment and created 11 new jobs.
- Contact Industrial Tooling (CIT) planned to create 10 new jobs and invest over $300,000 to build a 10,000-square-foot addition to its existing facility.
- Perpetual Recycling Solutions planned to invest $5.2 million in new machinery, building improvements and employee training.
- Grafcor Inc. expanded its business in Richmond. The project created 33 new jobs and retained 17 jobs. The company also planned to invest around $1.5 million in building improvements, relocation and installation of equipment, the purchase of new IT equipment, and employee training.
- Hill’s Pet Nutrition, Inc. planned to invest more than $500,000 to build a training center at its facility to provide basic and advanced manufacturing skills for all of its employees.
Forecast
Unquestionably, Wayne County and the region’s economy strengthened in most areas during the first eight months of 2015, based on the available data. These improving economic conditions have been acknowledged by local businesses, according to the results of the business survey conducted by the IU East Business and Economic Research Center in the summer of 2015. In light of the participants’ responses, the overall business sentiment tends to be viewed as favorable. Specifically, over half of the 85 firms surveyed felt their business performed either somewhat stronger or much stronger than during the same period last year.
When asked about their hiring projections for 2016, nearly 62 percent of survey participants responded that they will remain their current workforce size. More than one-third of firms plan on increasing their size by hiring either significantly more people (more than 10 percent) or slightly more (less than 10 percent). In regard to the capital spending next year, over half of them indicated that they will invest about the same amount of capital as they did this year. However, about 44 percent of them revealed that their firms will increase capital spending either significantly or slightly. Finally, when asked their opinion of the 2016 business and economic conditions in Wayne County, nearly half of participants expressed a sanguine forecast. About one-third felt business and economic conditions will remain the same. Less than one-fifth projected declining conditions for next year.
Nevertheless, some uncertainty hangs over the domestic and global stages, which might temper the region’s economic forecast. The recent job and export data and the unstable stock market signal that the U.S. economy might falter. In the international backdrop, major economies such as China and the European Union, are still trying to find a way out for their struggling economies. The International Monetary Fund (IMF) recently downgraded its projections for global growth in 2016 and warned of a rising risk of a global recession.2 Similar worries may play a role in the Fed’s delay in raising short-term interest rates.
Overall, taking into account the national and global picture and the local business feedback, we anticipate that our region’s economic growth will likely remain in positive territory, but that the growth will be moderate. Although the unemployment rate recently hit a seven-year low point, the 4 percent unemployment rate seems to be a blip. The unemployment rate is likely to hover in the 5-6 percent range. New job openings could be lukewarm since local businesses may be cautious in hiring new people due to domestic uncertainties. The change in employment and wages is expected to be low, which can have an adverse effect on the local housing market.


