Indiana’s Outlook for 2016
Research Associate, Indiana Business Research Center, Kelley School of Business, Indiana University
Director of Economic Analysis, Indiana Business Research Center, Kelley School of Business, Indiana University
Last year, in the fall of 2014, when we were forecasting the year ahead, the world and nation were being contorted by several forces. The Ebola outbreak in West Africa caused panic and galvanized a global response. There were border confrontations between Ukraine and Russia reminiscent of the worse Cold War tensions. And the wars in Afghanistan, Iraq and Syria provided a constant dental-drill drone. The engines of global economic growth—the BRICS (Brazil, Russia, India, China and South Africa)—were slowing, and no one was looking to Europe to provide any buoyancy to the global economy.
Domestically, the politics of race once again became part of the country’s consciousness, daily conversation and recriminations. The Republicans took control of the Senate in midterm elections. Closer to home and just a few months later, Indiana gained unwanted attention with the passage of the Religious Freedom Restoration Act, which many believed would place the state at an economic disadvantage.
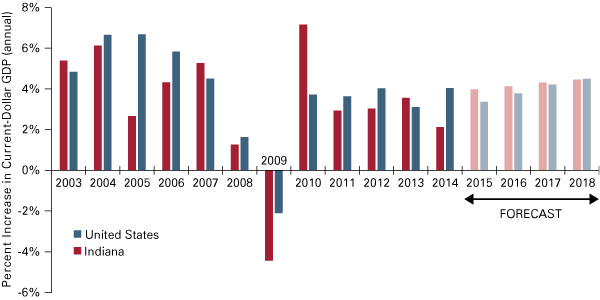
Last fall, we expected economic growth (measured in current dollars) to be close to 4 percent in Indiana for 2015, slightly higher than the (then) expectations for 2014. Expectations can disappoint. Turns out that 2014 did not end as well as anticipated, with Indiana’s economic growth at 2.1 percent, nearly half of the national number of 4.0 percent. Indiana is likely to reverse that trend in 2015. At the time of this writing, we forecast current-dollar economic growth to be 3.7 percent in Indiana compared to 3.4 percent nationwide.
GDP Growth
Indiana has trailed the U.S. in GDP growth for three out of the past four years, but is expected to grow at a slightly faster rate than the U.S. through at least 2017. Figure 1 shows the relationship between Indiana and U.S. GDP growth since 2003.
Figure 1: Change in Indiana and U.S. Gross Domestic Product

Source: IBRC, using U.S. Bureau of Economic Analysis and Indiana University Center for Econometric Model Research data
As GDP is an aggregate of the production totals from many different sectors with mixed performances, some sectors prosper while others don’t. In 2014, the increases in manufacturing of both durable and nondurable goods outpaced the overall growth rate. These increases, however, were offset by double-digit percent decreases in mining and agriculture.
While Indiana-specific conditions can affect economic performance, Indiana’s economic growth can also be affected by the outside domestic and international demand for Indiana’s goods and services. To that end, the assumptions of lower or higher exports can have a big influence on the forecast. Given Indiana’s status as a manufacturing powerhouse, its GDP could be boosted by strong demand for industrial machinery and automobiles.
As it happens, 2015 was a great year for auto sales. After a strong 2014 that saw auto sales hit over 16 million units, and a monthly sales rate in August 2014 that was the highest since the middle of 2006, year-to-date 2015 has seen sales of 13.1 million, 5.0 percent higher than the same time period in 2014, according to Motor Intelligence. This increase is expected to continue through the end of 2015 and onwards.
The great news on the auto manufacturing front having been noted, one should be mindful that the state’s fortunes don’t rise and fall with the auto sector. Thanks in part to pharmaceuticals and medical device sales, the state bounced back from the Great Recession relatively strongly in 2010—twice the national rebound—even as auto sales hovered around a mere 11.5 million units.
Employment
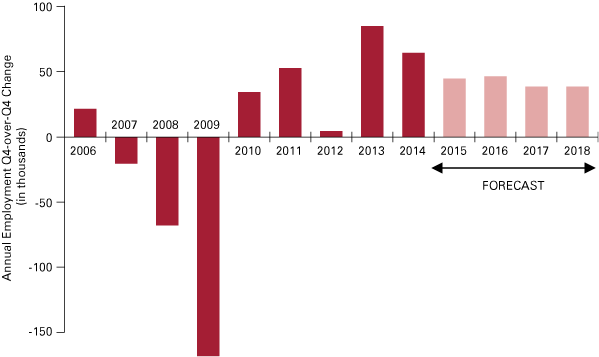
The state has been doing well on the employment front (see Figure 2). The year began with a seasonally adjusted unemployment rate of 6.0 percent, but by September 2015, the rate had decreased to 4.5 percent (preliminary estimate, seasonally adjusted). It is expected to continue to drop until it is significantly below the “go-go” times of July 2007 when it had dipped to 4.5 percent.
Figure 2: Indiana Employment Growth

Source: IBRC, using U.S. Bureau of Labor Statistics and Indiana University Center for Econometric Model Research data
While 2015 GDP actual results were below last year’s forecast, the actuals for unemployment in 2015 greatly exceeded expectations. The decrease from 6.0 percent to 4.5 percent or better by the end of the year exceeds last year’s forecast of 5.3 percent by the end of 2015.
Exports
From 2013 to 2014, Indiana’s exports increased by 3.8 percent, beating the national export growth of 2.9 percent. Last year’s acceleration is especially encouraging given that exports decreased by 0.7 percent in Indiana the previous year, even while national exports increased by 2.2 percent from 2012 to 2013. Indiana is more export dependent relative to most other states, shipping a greater percentage of state output overseas.
Transportation equipment and the life sciences (pharmaceuticals and medical devices, mostly) are Indiana’s leading exports with $10.5 billion and $8.7 billion in value, respectively. Both of these segments saw year-over-year growth. Filling out the rest of the top five export industries in Indiana are industrial machinery (which includes engines) at $4.2 billion, miscellaneous manufacturing at $2.1 billion, and computer and electronic products at $1.8 billion.
About half of Indiana’s $35.5 billion in exports went to our nearest neighbors, Canada ($12.2 billion) and Mexico ($5.0 billion). Both of these countries saw year-over-year increases, with exports to Canada increasing by 3.6 percent and exports to Mexico increasing by a staggering 25.5 percent. Exports to China, the United Kingdom, South Korea and Australia also increased, while exports to the eurozone dropped.
Despite the overall positive news regarding exports, there are potentially ominous signs. The strong U.S. dollar and the economic doldrums in Europe could dampen the hopes for strong exports to the eurozone. Exports to these countries are dominated by pharmaceuticals, medical devices, industrial machinery and aircraft/spacecraft components. Additionally, the sagging growth in the BRICS also creates some downside risk, as China’s growth has gone from warm to tepid and the Brazilian economy has moved from tepid to chilly. Russia’s economic prospects are also chilly, but that is not expected to affect Indiana’s exports since it has not traditionally been a large market for Hoosier goods.
Housing
The Indiana housing market improvement has been choppy but current signs appear to be more hopeful. As of August year-to-date (YTD), closed sales for Indiana were up 8.9 percent compared to the same time period in 2014. On balance, this was a sizeable increase considering that closed sales for Indiana YTD August 2014 were down 5.1 percent compared to the previous year. Median sales prices have continued an upward trend, with August YTD prices 6.3 percent higher than the same time period in 2014. These two favorable trends may reflect the fact that the housing market recovery has finally gained complete traction after the Great Recession.
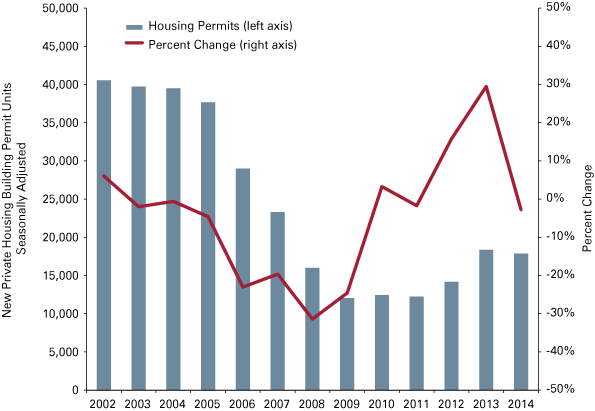
Note the qualifying “may.” In late 2014 and early 2015, private housing unit permits decreased slightly. While not significantly down in 2015 YTD, new building permits have not maintained the steady upward trends that they showed over the past several years (see Figure 3). Nevertheless, the inventory of homes for sale and months’ supply of homes for sale have both decreased over the past year, -13.9 percent and -20.3 percent, respectively.
Figure 3: Indiana Building Permits, New Private Housing Units

Source: U.S. Census Bureau
At this time last year, the Federal Reserve backed off its statements that interest rates will be increased imminently and it appears that in the fall of 2015, we are seeing a replay of the “will the Fed or won’t the Fed” guessing game. The uncertainty surrounding the Fed’s actions indicate that the housing recovery is still fragile and the Federal Reserve doesn’t want to dampen any momentum in this critical sector that, traditionally, has helped lead the economy out of recessions.
In Closing
The forecast range for the state in 2016 runs from “qualified upbeat” to “same old, same old.” Strong domestic car sales and a recovering housing market are a couple of reasons for optimism. A tepid global economic outlook, the constraints on many domestic demand drivers—whether government spending or the need to rapidly expand the construction of new houses—and the tepid rate of business investment are causes for concern. Discretionary consumer spending is likely to remain warm—as it happens, only consumer discretionary spending stocks performed well from January through September 2015—but auto sales and meals at casual dining restaurants will not be sufficient to propel the national or Hoosier economy to the rates of growth accustomed to before the Great Recession.
Over the last several years, the national and state economies have had to endure a climate of policy uncertainty—health care, environment, federal debt limits and banking regulation, to name a few—and this has put a damper on both consumer and business confidence. Given the ongoing tug-of-war between Congress and the Executive Branch, and with the Federal Reserve unable to get a decisive read on the direction of the economic winds—both overlaid with the upcoming national election at the end of 2016—it would be a safe bet that policy and economic uncertainty will persist. At the end of 2016, we may be happy to say: Well, the Indiana economy schlepped through another year.


