Fort Wayne Forecast 2016
Director, Community Research Institute, Indiana University–Purdue University Fort Wayne
Labor Force Availability
September 2015 unemployment rates for Metro Fort Wayne ticked down to 3.8 percent, marking a 15-year low and edging beyond what economists deem “full employment.” Over the last five years, the size of the region’s labor force has declined by about 1 percent (moving from 208,009 in 2010 to 206,442 in 2015). During this time, the unemployed segment of the labor force moved from nearly 19,898 to 7,803, an average annual change of -2,302 per year. The employed segment moved from 188,111 to 198,639, an average annual change of +2,100 per year. In other words, Fort Wayne has been transitioning workers into employment for several years and, absent growth in the labor force via migration or higher rates of labor force participation, worker availability is growing scarce.
In Metro Fort Wayne, net population growth is driven by natural change (births minus deaths) rather than migration. As shown in Table 1, the baby-boom generation (102,368) accounts for 24 percent of the region’s total population and is 24,930 people larger than the generation following, Generation X. Without migration to fill the gap created in the labor force by the so-called “Silver Tsunami” of retirements, employers will be challenged to find experienced workers.
Table 1: Generational Spread of Metro Fort Wayne’s Population
| Date of Birth | Age in 2015 | Number | Percent | |
|---|---|---|---|---|
| Greatest Generation | Until 1945 | 70+ | 38,907 | 9% |
| Baby Boomers | 1946-1964 | 50-69 | 102,368 | 24% |
| Generation X | 1965-1981 | 35-50 | 77,438 | 18% |
| Millennials | 1982-2004 | 10-34 | 140,976 | 34% |
| TBD | 2005-Present | 0-9 | 58,916 | 14% |
| Total | 418,605 | 100% | ||
Note: Percent totals do not add to 100 due to rounding.
Source: ESRI Community Analyst, IPFW Community Research Institute
Over the course of the last three years, the size of the regional labor force has remained relatively flat even as the unemployment rate has declined. The confluence of these dynamics shows a tightening labor market. This is a national issue, one that is not unique to Fort Wayne.
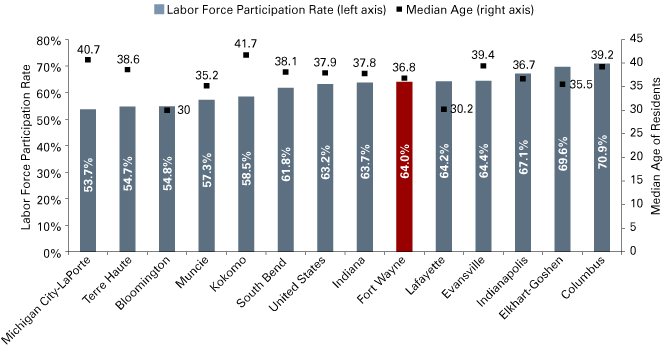
As shown in Figure 1, labor force participation rates for Metro Fort Wayne are slightly higher than those for the state and the nation and are a full 10 percentage points higher than in some areas of the state. Even so, the impact of retirements is a key factor causing local labor force participation to edge downward by 3.6 percent in the last three years.
Figure 1: Labor Force Participation Rates and Median Age of Residents, September 2015

Note: Community names denote metropolitan statistical areas.
Source: STATS Indiana, using U.S. Bureau of Labor Statistics data, and ESRI Community Analyst
Employment and Wage Dynamics
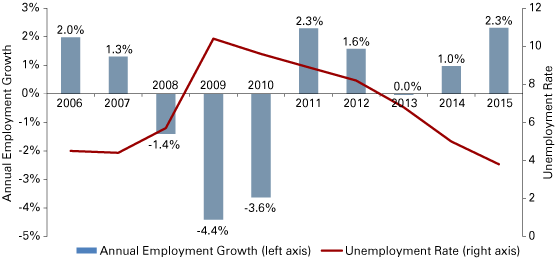
Last year’s forecast predicted employment growth of about 2 percent, a tightening labor market and unemployment in the range of 4.0 percent, which together would result in pressure to increase wages. Figure 2 shows annual employment growth and unemployment rates since 2000. While 2015 employment estimates are preliminary, the data has trended more or less as expected.
Figure 2: Annual Employment Growth and Unemployment Rates in Metro Fort Wayne

Note: 2015 employment estimates are preliminary.
Source: U.S. Bureau of Labor Statistics, most recent series available from the Quarterly Census of Employment and Wages (Q1) and Local Area Unemployment Estimates (September)
Table 2 shows employment change and average annual wage by industry. Between the first quarters of 2014 and 2015, the region added 4,491 jobs, bringing the metro job base to just below 200,000. Health care led in job creation, accounting for one-in-four new jobs; however, average wages in this industry rose only 0.5 percent. The strongest wage gains were seen in lower-wage sectors like retail, agriculture, and accommodation and food services, as well as in wholesale trade and manufacturing. Overall, average wages grew by about 2 percent.
Table 2: Metro Fort Wayne Employment by Industry
| 2015 Q1 | One-Year Change, 2014-2015 | |||||
|---|---|---|---|---|---|---|
| Jobs | Average Annual Wage | Fort Wayne Metro | Indiana | |||
| Total | 199,498 | $42,900 | 4,491 | 2.3% | 62,729 | 2.2% |
| Health Care and Social Services | 34,194 | $45,864 | 1,065 | 3.2% | 5,516 | 1.4% |
| Administrative and Support and Waste Management and Remediation Services | 11,167 | $23,556 | 899 | 8.8% | 7,170 | 4.2% |
| Accommodation and Food Services | 17,590 | $13,988 | 858 | 5.1% | 8,802 | 3.6% |
| Educational Services | 15,285 | $34,892 | 466 | 3.1% | 2,946 | 1.1% |
| Retail Trade | 22,321 | $25,636 | 376 | 1.7% | 4,167 | 1.3% |
| Construction | 8,375 | $48,776 | 334 | 4.2% | 4,668 | 4.3% |
| Manufacturing | 34,720 | $58,500 | 309 | 0.9% | 15,893 | 3.2% |
| Wholesale Trade | 9,826 | $52,468 | 188 | 2.0% | 2,767 | 2.4% |
| Professional, Scientific, and Technical Services | 6,004 | $50,440 | 186 | 3.2% | 4,463 | 4.2% |
| Transportation and Warehousing | 9,280 | $44,668 | 154 | 1.7% | 1,697 | 1.3% |
| Real Estate and Rental and Leasing | 2,270 | $35,880 | 123 | 5.7% | 396 | 1.2% |
| Other Services (Except Public Administration) | 5,827 | $25,376 | 101 | 1.8% | 1,783 | 2.2% |
| Agriculture, Forestry, Fishing and Hunting | 415 | $29,172 | 30 | 7.8% | 424 | 3.3% |
| Arts, Entertainment, and Recreation | 1,992 | $17,784 | 19 | 1.0% | -39 | -0.1% |
| Public Administration | 6,078 | $47,372 | 16 | 0.3% | 761 | 0.6% |
| Finance and Insurance | 8,504 | $80,028 | -43 | -0.5% | 1,955 | 2.1% |
| Information | 3,211 | $55,952 | -311 | -8.8% | -1,577 | -3.8% |
| Mining | ND | ND | ND | ND | 49 | 0.8% |
| Utilities | ND | ND | ND | ND | -436 | -2.7% |
| Management of Companies and Enterprises | ND | ND | ND | ND | 1,318 | 4.2% |
Note: ND indicates that the data were non-disclosable.
Source: STATS Indiana, using Quarterly Census of Employment and Wages data from the U.S. Bureau of Labor Statistics
The Year Ahead
Metro Fort Wayne manufacturing growth has been sluggish, just 0.9 percent year-over-year. In September, the Institute for Supply Management’s (ISM) Manufacturing Index, which tracks the health of the U.S. manufacturing industry, trended downward for the fourth straight month. At its current level of 50.1 (as of October 2015), it sits just above what many economists deem to be the threshold for sector contraction (50.0). At the same time, ISM’s Non-Manufacturing Index hit the second-highest point in the last decade (59.1) signaling a healthy service sector.
Nationally, manufacturing accounts for 12 percent of GDP; however, in Metro Fort Wayne, it accounts for 32 percent. Lagging indicator real GDP for 2014 was released in September for all U.S. metro areas. Fort Wayne showed slower regional real GDP growth compared to the prior year (0.4 percent vs. 0.8 percent), with a -0.7 percent decline in manufacturing buoyed by a 1.0 percent growth in service-providing industries. The strength of the U.S. dollar (export potential) and oil prices are two factors that will impact the manufacturing sector’s potential for 2016, with additional local pressures from ongoing defense sequestration.
With this in mind, based on EMSI, Inc. projections and Community Research Institute analysis, we presume that employment in the Fort Wayne region will be modest in 2016, perhaps growing by about 1 percent in the three-county area. Even with this, unemployment may plunge farther down as demand for workers is induced by the continuation of baby boomer retirements.


