Seeking Escape Velocity—Jobs, Income and Productivity Forecasts
Deputy Director, Indiana Business Research Center, Kelley School of Business, Indiana University
Economists have lately been looking at our sluggish job growth as an increasing drag on the growth of the economy, akin to gravitational pull. They are watching the data to spot when we might reach escape velocity, launching us out and away from the “gravitational” drag of no/low-growth and out of the job growth deficit. It is worth watching jobs, income and gross domestic product (productivity) forecasts for any signs of escape velocity for Indiana and its metropolitan areas in 2014.
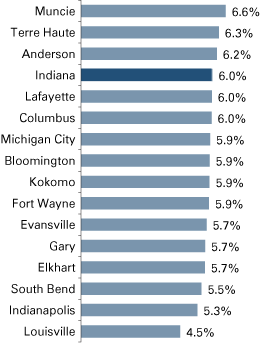
Indiana is expected to see a 6 percent increase in PCPI in 2014. The metros at the front end of this growth (growing at a faster rate than the Indiana forecast) include Muncie, Terre Haute and Anderson (see Figure 1).
Figure 1: Per Capita Income Growth Forecast, 2014

Source: IBRC, using subscription data from Economy.com
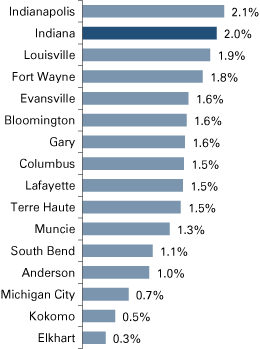
Growth in GDP is expected to be around 2 percent in Indiana, led by the Indianapolis-Carmel metro (see Figure 2).
Figure 2: GDP Growth Forecast, 2014

Source: IBRC, using subscription data from Economy.com
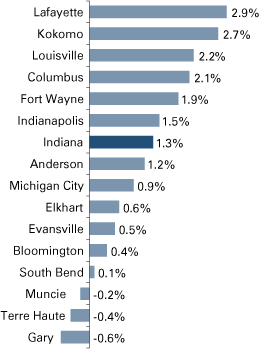
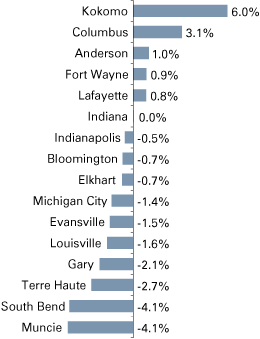
The Lafayette metro is forecast to lead job growth in Indiana, with a 2.9 percent increase expected for 2014, compared to Indiana’s 1.3 percent growth forecast (see Figure 3). Figure 4 gives us a closer look at manufacturing specific job growth expected in 2014. While Indiana’s manufacturing jobs are expected to remain stable, Kokomo’s forecast looks for 6 percent growth in manufacturing in 2014.
Figure 3: Jobs Forecast, 2014

Source: IBRC, using subscription data from Economy.com
Figure 4: Manufacturing Jobs Forecast, 2014

Source: IBRC, using subscription data from Economy.com
These forecasts of change may not match those of our authors, but that’s okay. There is a long and honorable tradition in economics of always having multiple forecasts (think of the Truman line “give me a one-handed economist” in reference to economists often saying “on the one hand … on the other hand”). The indicators shown here are from Moody’s and use the 2012 metro delineations. These data are useful as a starting point, but keep in mind what you can’t get from Moody’s is the insight and analysis of Indiana economists who live and work in Indiana, as evidenced in this, our annual Outlook issue. Let this small piece simply serve as a snapshot of what might occur in the next year as we all seek escape velocity.
Notes
- Strictly speaking, GDP is equal to all value-added in the economy. Value-added in a strict national income accounting framework can be measured by subtracting the cost of materials, energy and purchased services from revenues (or in this case the value of shipments).
- Companies represented by NAICS 541712 provide research and experimental development in the physical, engineering, and life sciences, such as agriculture, electronics, environmental, biology, botany, computers, chemistry, food, fisheries, forests, geology, health, mathematics, medicine, oceanography, pharmacy, physics, veterinary and other allied subjects.
Also in this Issue…
- International Outlook for 2014
- U.S. Outlook for 2014
- Financial Outlook for 2014
- Housing Outlook for 2014
- Indiana's Outlook for 2014
- Indiana's Agricultural Outlook for 2014
- Seeking Escape Velocity—Job, Income and Productivity Forecasts
- Anderson Forecast 2014
- Bloomington Forecast 2014
- Columbus Forecast 2014
- Evansville Forecast 2014
- Fort Wayne Forecast 2014
- Gary Forecast 2014
- Indianapolis-Carmel Forecast 2014
- Lafayette Forecast 2014
- Louisville Forecast 2014
- Muncie Forecast 2014
- Richmond Forecast 2014
- South Bend and Elkhart Forecast 2014
- Terre Haute Forecast 2014


