Indiana's Outlook for 2014
Director of Economic Analysis, Indiana Business Research Center, Indiana University Kelley School of Business
When looking into our economic crystal ball last year, about the only thing we could see was a dense mist of uncertainty for 2013. The nation was heading for the fiscal cliff and, with the exception of the Federal Reserve’s continuing policy to provide financial liquidity, all the effects of the stimulus package from four years ago had run their course. Whether they knew it or not, workers were going to feel a hit in their 2013 take-home pay as the 2 percent payroll tax holiday expired January 1.
The payroll tax holiday and the continued uncertainty about the fiscal cliff, the early 2013 debt ceiling negotiations and the mandatory across-the-board cuts in government spending, a.k.a. “the sequester,” resulted in our outlook for economic growth in Indiana going from sub-par in 2012 to below sub-par in 2013.
And below-sub-par is what we got.
Employment and Growth
As the economic recovery gained traction, the Indiana economy regained about half of the jobs lost during the recession (2008 and 2009), gaining 57,000 jobs in 2011, and 56,000 jobs in 2012. Sub-par for a recovery bounce-back, but better than the alternative. Unfortunately, by the end of 2013, Indiana is expected to have added only 37,200 jobs.
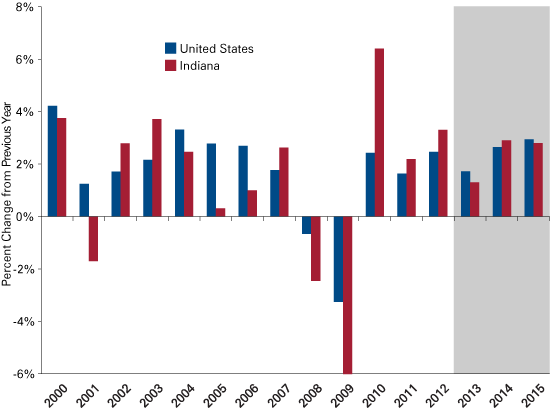
Gross domestic product (GDP) growth followed a similar pattern. Indiana’s GDP took a bigger hit than the nation’s in 2008 and 2009, as Figure 1 shows. Output growth rebounded more quickly in the Hoosier state and has since run a tick above the national growth rate. The year 2013, however, is a departure. The year is expected to close out with a growth rate about 1.3 percent (compared to the United States at 1.7 percent).
Figure 1: Indiana Gross State Product and U.S. Gross Domestic Product, Annual Change, 2000 to 2015

Source: IBRC, using Bureau of Economic Analysis and Center for Econometric Model Research data
Before the September 2013 moderation in auto sales, the auto sector was on track to sell about 16 million units, an annual rate not attained since November of 2007. Considering the buoyant auto sales and the importance of motor vehicle manufacturing in the state, the disappointing growth in 2013 may be something of a head-scratcher. But consider this, while the state is a manufacturing powerhouse relatively speaking, all manufacturing represents 28.6 percent of state output. As a result, even though manufacturing GDP increased about 7.2 percent in 2012, when averaged with the 2.3 percent growth of private services, state output grew 3.3 percent. All this to say is that Indiana’s auto sector may be close to having a banner year in 2013. Auto output in the state may grow well over 10 percent when the tallying is done, but this is not sufficient to pull up state GDP growth to a healthy level.
Next year, Indiana output growth is expected to double and eclipse the nation’s rate. That said, it is forecast that neither Indiana nor the United States will return to long-run growth trends. Rather, more of the sub-par growth rates are expected.
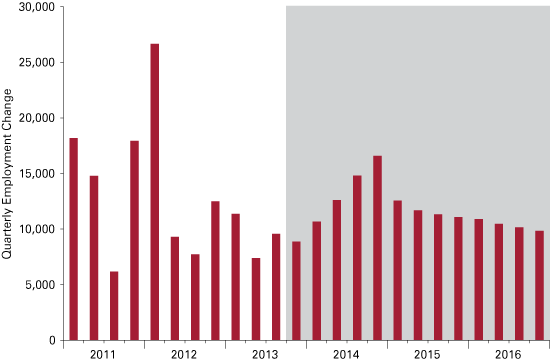
On the employment front, the return to sub-par growth is likely to generate an additional 55,000 jobs in 2014, about the same rate as in 2011 and 2012. With the forecast of 47,000 new jobs added to the Indiana economy in 2015, the state will then be back to pre-recession employment levels of 2007. Figure 2 presents quarterly employment change in the state over the last three years and the forecasted growth in employment for the next three years.
Figure 2: Indiana Employment Growth, 2011 to 2016

Source: IBRC, using Bureau of Labor Statistics data
Indiana’s unemployment rate rose dramatically during the recession, topping out at 10.8 percent. The rate has declined steadily since then to 8.4 percent in 2012 and for 2013 is expected to average 8.1 percent. The unemployment rates for 2014 and 2015 are forecast to fall around a percentage point each year, closing at an annual average of 6.8 and 6.0 respectively. It won’t be until 2016 that the rate is expected to reach “full employment,” about 5.5 percent.
Personal Income
Since the beginning of the recession, Hoosiers’ personal income has achieved something it was unable to for years, keeping pace with the nation. Better than that, it’s been catching up. Indiana personal earnings have risen more rapidly than the national average, led by earnings from durable goods manufacturing, transportation and warehousing, and farming.
Indiana’s per capita personal income (PCPI), that simple and serviceable measure of economic well-being, has stabilized. The gap between U.S. PCPI and Indiana PCPI widened in the first decade of the century, but while the large gap has been a source of consternation of breadwinners and policymakers, the gap has closed ever-so-slightly.
Personal income has taken some interesting turns over the last year or so. In late 2012, many people sold their financial assets to avoid the rise in capital gains taxes in 2013. As a result, personal income spiked in December 2012. In early 2013, payroll taxes returned to their pre-recession rates, scooping an additional 2 percent out of workers’ paychecks. The erratic swings in personal income could help account for the less than robust rate of economic growth in early 2013.
Housing
Indiana’s housing market continues to improve, with sales up 17.4 percent and average prices up 4.3 percent through September, compared to last year. The inventory of homes for sale (down 1.4 percent) and the months of supply of homes for sale (down 16.4 percent) are also moving in the right direction.
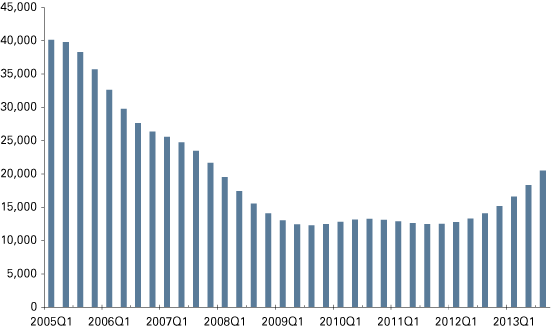
Home construction, which began its slide in the state beginning in 2005, is on the mend. Building permits are showing slow but steady progress, reflecting the increasing optimism of home builders and increasing traffic from prospective buyers wanting to get into a house before long-term mortgage rates close them out of the market (see Figure 3). This brings us to a growth threat alert. Thirty-year mortgage rates track with 10-year treasury securities and the interest rate on the T-Bills has risen by about 1 percentage point over the last six months. Too fast a rise—a financial market nervous about inflation or other factors such as government credit worthiness being downgraded—would hammer the fragile housing recovery. (It is important to keep in mind that housing usually helps lead the economy out of a recession.)
Figure 3: Indiana Building Permits, All Types, 2005 Q1 to 2013 Q3

Source: Moody’s Analytics, using U.S. Census Bureau data
Recreational Vehicles
Indiana, or at least Elkhart County and its environs, depends on the recreational vehicle (RV) industry. RV manufacturing in Indiana accounts for 83 percent of the nation’s RV production. RV manufacturing as an industry, and Elkhart County as a location, were the poster children for the devastating effects of the Great Recession.
Good news: the RV industry is back. In 2012, 8.5 percent of all U.S. households owned an RV—the highest in history—up from 8 percent in 2005. The Recreation Vehicle Industry Association (RVIA) estimates 2013 total production will total 319,300 units, implying that Elkhart County will account for producing 265,000 units in 2013.
In the coming year, RV production and sales are expected to grow in the range of 5 percent to 10 percent according to the RVIA. The 2014 RVIA also forecasts that RV sales will grow about 7.5 percent.
Pew Research Center notes 10,000 baby boomers will reach age 65 every day until 2029 and the RV industry is set to benefit. This points to favorable demographics for future RV growth as Baby Boomers define the face of retirement. Harris Interactive did a poll of RV owners, finding that 67 percent of potential RV buyers said that the RV lifestyle allows one to be more physically active, rather than sedentary, and this perception motivated purchases.
Leading Index for Indiana
The Indiana Business Research Center’s Leading Index for Indiana (LII) is an index similar to the Conference Board’s Leading Economic Index for the nation, except the LII is designed based on the structure of Indiana’s economy.
The LII in October rose 0.2 points to 101.8 from a revised 101.6 in September, the highest it has been since 2007. While home builders turned pessimistic, the transportation component of the index, the Purchasing Managers Index (a measure of manufacturing sentiment) and the auto sector indicator all rose a fraction.
These measures of economic conditions have been shown, historically, to predict future economic performance in 4 months to 6 months. But the index does not account for supply shocks (like oil price spikes due to Israeli bombs falling on Iran) or U.S. debt default (due to political intransigence in Washington). So, while the index may point to expected modest growth in 5 months, the economic future will likely be bumpy in the opening months of 2014, due to federal budget fights, the merely short term avoidance of government default and continued anxiety over the roll-out of the Affordable Care Act.
However, absent more major policy mess-ups emanating from Washington DC—what may be a naive hope given how the political forces are arrayed against prudence and fiscal responsibility— 2014 looks to be a good measure better than 2013.
Indiana’s Energy Future
Indiana is a major coal consuming state. In 2008, over half of Indiana’s energy came from coal, compared to less than 23 percent for the nation. From 2008 to 2012, U.S. consumption of coal dropped 4.3 percent and natural gas consumption rose 3.3 percent. By 2012, the nation’s use of coal stood at 18.3 percent, according to the Lawrence Livermore National Laboratory. (Data for states were not available for 2012.)
This shift is both monumental and rapid. Cheaper natural gas prices due to the supply surge attributed to hydraulic-fracturing of shale and tight gas formations are the forces behind this shift. But more stringent regulations of electricity generation are also responsible.
As a result of these new regulations, one can expect that Indiana power generation fuels will also shift from coal to natural gas. Indeed, Duke Energy and Indianapolis Power and Light have announced closings of coal-fired plants in the state. The closings of non-compliant plants, new plant design and planning, securing financial resources, getting regulatory approval for, and the construction of, alternative generation sources over the next few years may not be smooth.
In short, there may be deleterious economic ripple effects for both residential customers as well as industrial consumers that result from this transition. Indeed, Indiana’s electricity rates for industrial users have jumped from 2003 to 2012, according to the firm Lewis & Kappes, PC. Indiana’s rates for industrial users were the 5th cheapest in the country but by 2012, Indiana’s rank fell to 24th. To the extent that electricity rates make a location attractive to locate a company’s industrial operations, Indiana will get increasingly stiff competition from Illinois, Kentucky and Ohio, as these states have cheaper electricity costs.


