Indiana's Population Projections, 2010 to 2050
Demographer, Indiana Business Research Center, Kelley School of Business, Indiana University
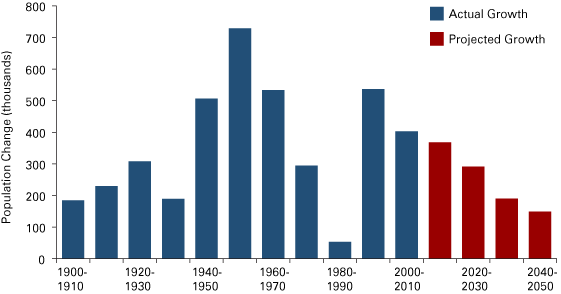
Between the years 2010 and 2050, Indiana’s population will increase 15 percent—from 6.48 million to 7.48 million residents—according to population projections released by the Indiana Business Research Center. More than one-third of this growth will take place in the next few years as the state’s population climbs to 6.85 million by 2020. Indiana will continue to grow over the following decades but at increasingly lower rates (see Figure 1).
Figure 1: Indiana Population Growth by Decade, 1900 to 2050
Source: U.S. Census Bureau and Indiana Business Research Center
On our way to adding another million Hoosiers, the state’s population will continue to undergo major shifts. Indiana’s population of 2050 will have a far different age structure and geographic distribution than it does today. These changes should not catch anyone off guard, however. Over the last decade or more, the aging baby boom generation has already transformed the state’s population, and a handful of metropolitan areas have captured the lion’s share of growth. This article will detail how the extension of these same trends will play out over the coming decades.
Aging Population
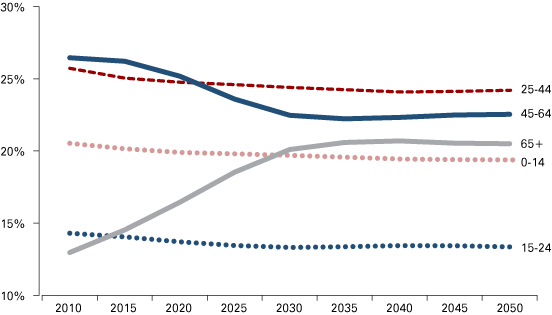
The dominant force behind Indiana’s changing population dynamics is the aging baby boom generation. The first boomers hit age 65 in 2011 and the entire cohort will be of traditional retirement age by 2030. By that point, the senior population’s share of the state total will jump from 13 percent in 2010 to 20 percent before beginning to level off (see Figure 2). All other age groups will see its share of total population decline over the same period.
Figure 2: Projected Share of Total Population by Age Group, 2010 to 2050
Source: Indiana Business Research Center
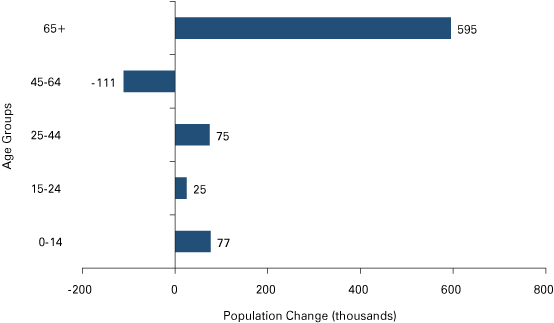
While other age groups will lose market share in the coming decades, most will still grow (see Figure 3). Both Indiana’s child population (age 0 to 14) and its younger adult age group (25 to 44) will increase by roughly 75,000 residents by 2030 and those around college age will be up by 25,000. These gains, however, will be dwarfed by the projected 70 percent increase in the number of Hoosiers age 65 or older.
Figure 3: Projected Poulation Change by Age Group, 2010 to 2030
Source: Indiana Business Research Center
The movement of boomers into retirement age will cause a temporary decline in the state’s older working-age population, which could have implications for the size of Indiana’s labor force and the state’s economic development prospects. However, any negative economic effects that may stem from a smaller labor force could be mitigated by the expected increase in labor force participation among older workers, productivity gains or higher than projected levels of net in-migration. Additionally, once the so-called baby bust generation edges into retirement age, the number of Hoosiers in the traditional labor force age groups will increase over today’s levels.
This graying of the population will usher in a host of other economic and public policy issues that are beyond the scope of this article. But as a demographic matter, aging will have another large impact on Indiana’s population trends. Namely, as the state ages, its population growth will slow (as seen earlier in Figure 1).
Populations grow or contract through migration and natural increase (the difference between the numbers of births and deaths). While migration plays an important role in population change, natural increase typically accounts for the majority of Indiana’s growth. For instance, between 2000 and 2010, Indiana had roughly 320,000 more births than deaths, which accounted for 80 percent of the state’s total population growth. Looking back at the 1980s, the state experienced a strong net out-migration, yet natural increase kept Indiana “in the black” in terms of population change.
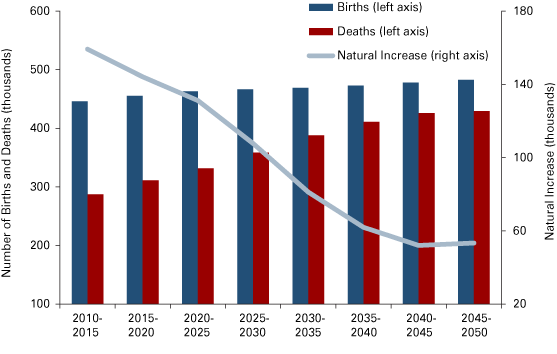
Over the next few decades, both births and deaths are projected to increase–but deaths will rise much faster due to the rapid growth of the senior population. Consequently, the natural increase of Indiana’s population will decline from 159,000 between 2010 and 2015 to as low as 52,000 between 2040 and 2045 (see Figure 4).
Figure 4: Projected Number of Births, Deaths and Natural Population Increase, 2010 to 2050
Source: Indiana Business Research Center
It’s important to note that the decline in natural increase levels off late in the projection period and actually ticks up between 2045 and 2050. So natural increase should continue to be a source of population growth for some time and will likely increase steadily in the second half of this century. While that is the case statewide, many local areas will see a shift to natural decrease in the coming decades.
Around the State
The 10-county Indianapolis-Carmel metro area1 has long been the state’s engine of population growth. Between 2000 and 2010, this region added 231,000 residents, which accounted for 57 percent of the state’s total growth. Central Indiana’s role will likely become more dominant in the future. Between 2010 and 2030, this metro area’s growth will be responsible for 62 percent of the state total. Over the next 40 years, the region could claim up to 70 percent of growth. The metro area’s share of Indiana’s population will increase from 27.1 percent in 2010 to 32.8 percent in 2050.
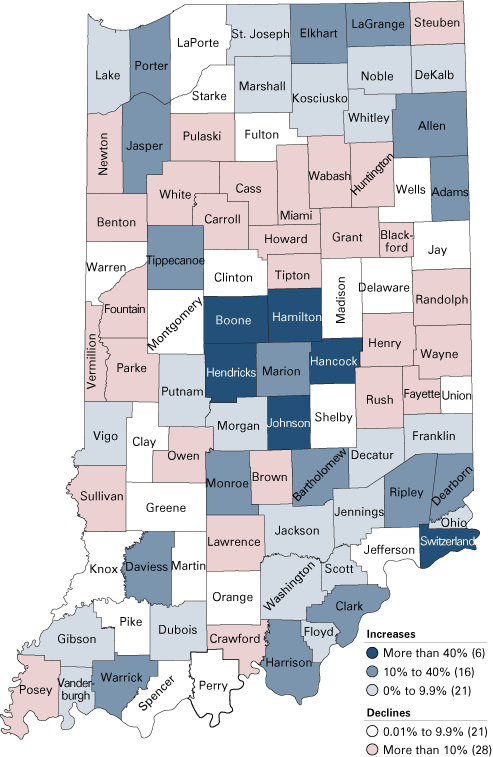
Hamilton County will continue to be the state’s fastest growing county as it doubles in size to 548,000 residents by 2050. If these projections bear-out, Hamilton County will surpass Lake and Allen counties to become the state’s second-largest county. Over the same period, Hendricks County’s population will climb to 268,000 residents—an 84 percent increase. Boone, Hancock and Johnson counties—also in the Indy metro area—will round out the state’s five fastest-growing communities.
Outside of Central Indiana, the four corners of the state should see strong growth too (see Figure 5). Clark and Harrison counties in the Louisville metro area will grow by 35 percent and 22 percent, respectively. Warrick County in the Evansville metro area, along with Porter County in Northwest Indiana and Elkhart County should each see a 25 percent increase. The Fort Wayne metro area is projected to grow by one-fifth.
Figure 5: Projected Population Change by County, 2010 to 2050
Source: Indiana Business Research Center
At the other end of the spectrum, though, there are equally distinct regions of population loss. Large swaths of mid-sized and rural communities in north, east and west-central Indiana are projected to shed residents over the next 40 years. Many counties in southwest Indiana are also likely to lose population. All told, 49 of Indiana’s 92 counties are expected to see a population decline by 2050.
At the root of these population losses is the expected decline in natural increase discussed earlier. Between 2000 and 2010, 29 Indiana counties lost population, yet there were an estimated 62 counties that had a net out-migration of residents over the same period.2 This means that the natural increase in 33 counties was large enough to offset the net out-migration.
A net outflow is projected to continue in many of these counties, although at increasingly lower rates. At the same time, due to the aging population, declining natural increases in many counties will no longer mask net out-migration. In fact, many counties will begin to experience a natural decrease as deaths rise and continued net out-migration leads to a decline in births. Between 2010 and 2015, seven counties will likely have more deaths than births. By 2050, roughly 60 counties are projected to have a natural decrease.
Consequently, large regions of the state will age rapidly while families concentrate more and more in a handful of metropolitan areas. This shift was evident in the last decade when Indiana was one of only a few states in the Midwest and Northeast to see an increase in its population under the age of 18—yet all of these gains occurred in just 24 counties.
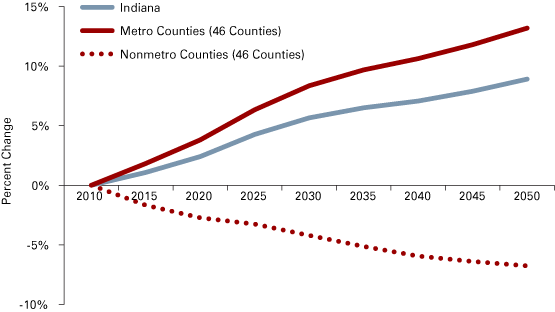
This trend is expected to continue. Figure 6 shows the projected change in the child population (age 0 to 14) for the state as well as for all counties in metropolitan statistical areas (MSAs) compared to those that are not. Led by the metro areas, Indiana should see steady increases in its child population while the state’s mid-sized and rural counties as a group will see a 6.5 percent decline by 2050.
Figure 6: Projected Change in the 0-to-14 Age Group, 2010 to 2050
Source: Indiana Business Research Center
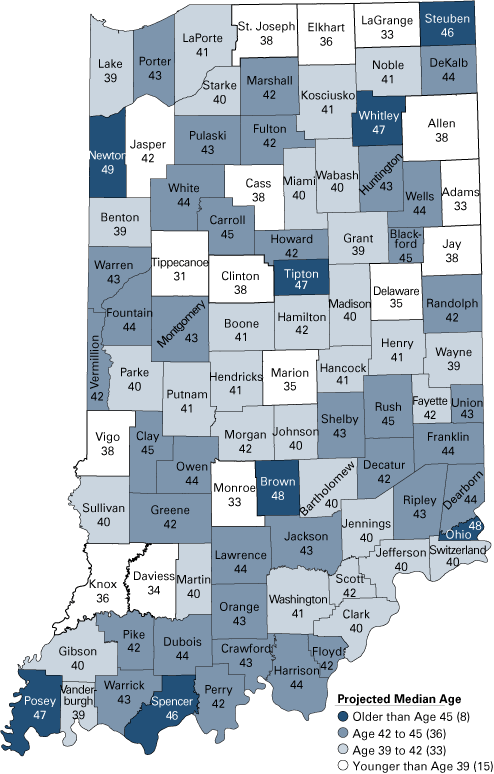
As a result, there will continue to be wide differences in aging patterns around the state (see Figure 7). In 2000, only one county had a median age above 40 but that number jumped to 39 counties in 2010. The number of counties with a median age above 40 will top-out in 2040 when 74 counties are projected to be above that mark. Indiana’s median age will increase steadily from 37.0 in 2010 to a peak of 39.1 in 2035. The state’s median age will hold steady at this mark through 2050.
Figure 7: Projected Median Age of the Population by County, 2050
Source: Indiana Business Research Center
It’s worth noting that many of these same trends will play out across the country, particularly in the Midwest and the Northeast. In fact, Indiana’s population is comparatively young. The state’s 2010 median age is a shade higher than neighboring Illinois but is roughly two years younger than Michigan and Ohio and one year below the Kentucky mark. Indiana is also younger than the U.S median age of 37.2.
About the Data
These population projections are purely demographic, meaning that they rely exclusively on recent birth/death data and migration estimates. Therefore, these figures are a reflection of what Indiana and its communities will look like if past trends continue. No assumptions have been made about future economic conditions or land use decisions.
Also, some population dynamics can be difficult to project. Migration, in particular, is the wild card, which means that long-range projections can be subject to significant error. Therefore, it is often useful to pay greater attention to trends during the next 15 to 20 years.
To access the entire population projection dataset or to read a detailed methodology, visit www.stats.indiana.edu/topic/projections.asp.
Notes
- The Indianapolis-Carmel MSA includes Boone, Brown, Hamilton, Hancock, Hendricks, Johnson, Marion, Morgan, Putnam and Shelby counties.
- Matt Kinghorn, “Migration Trends and Population Change between the Censuses,” Indiana Business Review, Fall 2011, www.ibrc.indiana.edu/ibr/2011/fall/article2.html.
Also in this Issue…


