Lafayette Forecast 2013
Economic Research Analyst, Indiana Business Research Center, Kelley School of Business, Indiana University
Nationally, the year 2012 had glimpses of positive news mixed with disappointing growth. However, the Lafayette Metropolitan Statistical Area (MSA), which includes Tippecanoe, Benton and Carroll counties, seems relatively sheltered from the national lethargy with its continued slow and steady growth. While the area has not experienced a rapid resurgence from the depths of the recession, it has rebounded more quickly than many other areas of the state.
As we look toward 2013, assuming that the national fiscal cliff issue is resolved in a timely manner, the MSA is poised to continue slow growth with announced business expansions, developments and hiring plans.The Lafayette MSA is viewed as an attractive area to live and work—in part due to Purdue University. We see this optimism in the continued population growth that is expected in the coming years (see Figure 1). In 2012, the population was estimated to increase 0.9 percent to 205,531 residents and maintain a 0.9 percent growth each year through 2015. This level of population growth is more timid than past time periods, namely the 1.9 percent average annual growth seen from 2005 to 2007, yet still is a step in the right direction.
Figure 1: Annual Population Change in the Lafayette MSA, 2000 to 2015
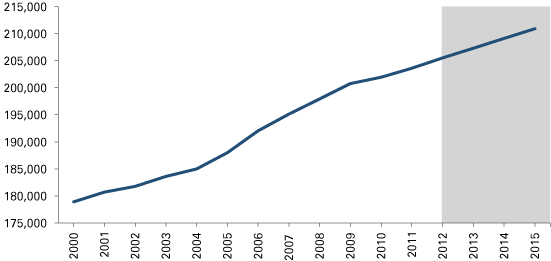
Note: Data for 2012 to 2015 are projections.
Source: IBRC, using U.S. Census Bureau data and Center for Econometric Model Research data
Labor
Over the past few years, the Lafayette MSA has had a lower unemployment rate than Indiana and the United States. The Lafayette MSA consistently outperformed Indiana and the United States (see Table 1). Even during the MSA’s unemployment peak in June/July,1 its rate was between roughly half a percentage point and 1 percentage point less than the state and nation’s rates. The spread in unemployment rates between the Lafayette MSA compared to the state and nation reflects the improved economy in the MSA. In conjunction with a declining unemployment rate and fewer unemployed individuals, the number of employed workers and individuals in the labor force has increased—indicating that individuals are finding work and have hope of obtaining a job. In fact, between September 2009 and September 2012, the Lafayette MSA has gained more than 4,100 jobs. The majority of these jobs were in Tippecanoe County (87.3 percent), yet each county’s employment growth ranged between 4 percent and 4.8 percent, indicating similar employment growth rates. These job gains exclude institutions and armed forces, thus the job gains are occurring within the public and private sector in the region.
Table 1: Labor Force Statistics for the Lafayette MSA, 2011 to 2012
| Unemployment Rate | |||||||
|---|---|---|---|---|---|---|---|
| Year | Month | Labor Force | Employment | Unemployment | Lafayette MSA | Indiana | U.S. |
| 2011 | August | 96,864 | 88,684 | 8,180 | 8.4% | 9.3% | 9.1% |
| September | 99,675 | 91,987 | 7,688 | 7.7% | 8.9% | 8.8% | |
| October | 100,681 | 93,118 | 7,563 | 7.5% | 8.8% | 8.5% | |
| November | 101,193 | 93,790 | 7,403 | 7.3% | 8.6% | 8.2% | |
| December | 99,648 | 92,226 | 7,422 | 7.4% | 8.6% | 8.3% | |
| Annual Average | 97,908 | 90,272 | 7,636 | 7.8% | 9.0% | 8.9% | |
| 2012 | January | 97,822 | 90,399 | 7,423 | 7.6% | 9.2% | 8.8% |
| February | 98,596 | 91,266 | 7,330 | 7.4% | 8.8% | 8.7% | |
| March | 99,139 | 91,863 | 7,276 | 7.3% | 8.6% | 8.4% | |
| April | 99,638 | 93,220 | 6,418 | 6.4% | 7.7% | 7.7% | |
| May | 98,109 | 91,246 | 6,863 | 7.0% | 7.8% | 7.9% | |
| June | 97,376 | 89,642 | 7,734 | 7.9% | 8.3% | 8.4% | |
| July | 96,659 | 89,177 | 7,482 | 7.7% | 8.3% | 8.6% | |
| August | 95,332 | 88,311 | 7,021 | 7.4% | 8.0% | 8.2% | |
| September* | 98,930 | 92,490 | 6,440 | 6.5% | 7.5% | 7.6% | |
*Preliminary data
Source: IBRC, using Bureau of Labor Statistics data
Table 2 looks specifically at the employment picture between 2011 and 2012 in the Lafayette MSA. Last year, it was predicted that employment would continue to increase at a steady pace. The manufacturing sector was anticipated to lead this growth—particularly in fabricated metals and motor vehicles, followed by health care, leisure and hospitality and the professional and business services sectors. In 2012, nearly all industries had employment growth and the manufacturing industry did create the largest number of jobs (733) since 2011 followed by private educational and health services (389).
Table 2: Lafayette MSA Employment, 2011 to 2012
| Industry | 2012* | Change since 2011 | Percent Change 2011–2012 |
|---|---|---|---|
| Total Nonfarm | 94,189 | 1,189 | 1.3% |
| Total Private | 68,278 | 2,078 | 3.1% |
| Goods-Producing | 18,367 | 667 | 3.8% |
| Manufacturing | 15,833 | 733 | 4.9% |
| Mining, Logging and Construction | 2,533 | 33 | 1.3% |
| Service-Providing | 75,822 | 422 | 0.6% |
| Private Educational and Health Services | 11,689 | 389 | 3.4% |
| Trade, Transportation and Utilities | 14,478 | 378 | 2.7% |
| Leisure and Hospitality | 8,944 | 244 | 2.8% |
| Professional and Business Services | 7,056 | 156 | 2.3% |
| Financial Activities | 3,733 | 133 | 3.7% |
| Information | 1,089 | -11 | -1.0% |
| Other Services | 2,933 | 33 | 1.1% |
| Government | 25,911 | -989 | -3.7% |
*January through September data annualized for 2012. September data are preliminary.
Source: IBRC, using Bureau of Labor Statistics data
The manufacturing increase stems from multiple businesses expanding in the region such as Subaru of Indiana Automotive, Purdue Research Park businesses, Wabash National, Rea Magnet Wire Co. and Alcoa. The private educational and health services sector will likely continue to gain jobs due to plans to build an inpatient rehabilitation hospital. Two industries, information and government, experienced employment declines in 2012. The drop in state and local government jobs at the MSA level reflects cuts made while government officials grapple with and reallocate budget funds. In 2013, employment growth will likely continue at its current pace, led by the manufacturing, health care and transportation sectors.
Between 2011 and 2012, average weekly wages increased 6.3 percent within the Lafayette MSA. Fourteen of the 18 major sectors (two were non-disclosed) had wage increases ranging from 15.6 percent in information to 1.3 percent in other services (see Table 3). The 2012 forecast predicted modest wage increases—in step with inflation and increased employment—which was verified with these results. Moving into 2013, it is anticipated that the average annual weekly wage will increase slightly, corresponding with the anticipated new jobs in manufacturing and health care services. As the housing market continues to stabilize and improve, wage increases will likely also occur in the real estate/rental/leasing and construction industries.
Table 3: Average Weekly Wages in the Lafayette MSA, 2012
| Industry | Average Weekly Wage | Change in Jobs since 2011:Q1 | Change in Average Weekly Wage |
|---|---|---|---|
| Total | $808 | 3.2% | 6.3% |
| Management of Companies and Enterprises | $2,222 | -0.5% | -2.7% |
| Manufacturing* | $1,376 | 11.3% | 9.3% |
| Professional, Scientific, and Technical Services | $988 | -2.4% | 9.4% |
| Wholesale Trade | $965 | 7.4% | 7.2% |
| Educational Services* | $951 | 1.5% | -1.6% |
| Finance and Insurance | $941 | -5.0% | -2.6% |
| Construction | $802 | 8.5% | 11.1% |
| Health Care and Social Services | $796 | 3.2% | 10.9% |
| Transportation and Warehousing | $785 | 0.1% | 9.3% |
| Public Administration | $727 | -1.6% | 2.8% |
| Agriculture, Forestry, Fishing and Hunting | $649 | 4.4% | 1.7% |
| Real Estate and Rental and Leasing | $607 | 4.1% | 11.8% |
| Information | $555 | 4.0% | 15.6% |
| Other Services (Except Public Administration) | $526 | 6.4% | 1.3% |
| Retail Trade | $442 | -2.4% | 8.6% |
| Administrative and Support and Waste Management and Remediation Services | $400 | 7.7% | -2.2% |
| Accommodation and Food Services | $256 | 2.6% | 6.7% |
| Arts, Entertainment, and Recreation | $225 | 2.6% | 6.1% |
*Some county data were excluded due to confidentiality.
Source: IBRC, using QCEW data
The Lafayette MSA’s per capita personal income (PCPI) historically lags behind the United States due to its occupational mix, student population and the fact that Indiana’s highest earning tier of occupations tend to be paid less than similar occupations elsewhere, regardless of cost of living factors.2 The most recent data showed the region’s PCPI at 85 percent of the national figure in 2010. It is projected that the PCPI increased approximately 4.3 percent in 2011 and by another 3.0 percent in 2012. During 2013, PCPI growth may slow to 2.5 percent.
Housing
In 2011, a sizable jump in the number of housing permits issued (134.3 percent for a total of 1,244 permits) within the Lafayette MSA was recorded, with the majority for single-family residences (see Figure 2). Of all the Indiana-based metros, the Lafayette MSA had the second-largest number of permits filed in 2011 behind the Indianapolis MSA. While this level of housing permits was certainly a welcome respite given the economy, it still trailed behind the peak of residential construction in 2000 when 1,830 permits were issued for single- and multi-family building permits. In 2012, 345 permits were issued (2012 data are January-to-August figures for Tippecanoe County only), which constitutes about a third of the 2011 metro figures. However, based on last year’s forecast, permit issuances must have surged in the third and fourth quarters, so the same situation may yet occur in 2012. Housing markets are improving, a trend that will likely be reflected in the Lafayette MSA during 2013.
Figure 2: Lafayette MSA Residential Building Permits, 1990 to 2012
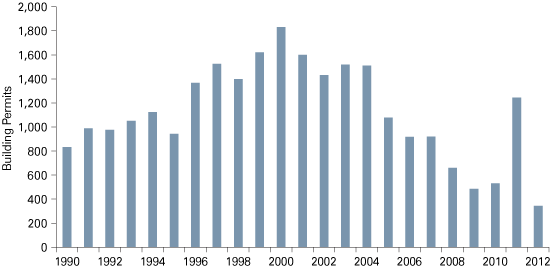
Note: 2012 data reflects year-to-date figures through August for Tippecanoe County only.
Source: IBRC, using U.S. Census Bureau data
Table 4 compares year-to-date (January through September) figures to illustrate that the Lafayette MSA real estate market has picked up in 2012. This is indicated by an uptick in listings (6.4 percent) and closed sales (17.3 percent), along with a decline in the months’ supply of inventory (-23.5 percent) and inventory of homes (-7.4 percent). As of September 2012, the Lafayette MSA had nine months’ worth of housing inventory to sell—a declining number likely associated with the smaller inventory in Tippecanoe County (6.5 months).
The median sales prices for the sold homes varied, with Benton County witnessing a -34.3 percent drop in prices and Carroll County seeing a 28.1 percent increase. Nationally, the housing market appears to have hit bottom and is now climbing upward. In 2013, Lafayette’s housing market is expected to maintain its steady yet slow growth.
Table 4: Lafayette MSA Year-to-Date Residential Real Estate Sales, 2011 to 2012
| Lafayette MSA | Benton County | Carroll County | Tippecanoe County | |||||||||
|---|---|---|---|---|---|---|---|---|---|---|---|---|
| 2011 | 2012 | Change | 2011 | 2012 | Change | 2011 | 2012 | Change | 2011 | 2012 | Change | |
| New Listings | 2,578 | 2,742 | 6.4% | 90 | 89 | -1.1% | 232 | 243 | 4.7% | 2,256 | 2,410 | 6.8% |
| Closed Sales | 1,402 | 1,645 | 17.3% | 45 | 47 | 4.4% | 101 | 112 | 10.9% | 1,256 | 1,486 | 18.3% |
| Median Sales Price | n/a | n/a | n/a | $68,500 | $45,000 | -34.3% | $79,250 | $101,500 | 28.1% | $124,000 | $128,000 | 3.2% |
| Months Supply of Inventory* | 12.1 | 9.2 | -23.5% | 13.9 | 9 | -35.3% | 14.5 | 12.2 | -15.9% | 7.8 | 6.5 | -16.7% |
| Inventory of Homes for Sale* | 1,264 | 1,170 | -7.4% | 65 | 49 | -24.6% | 157 | 153 | -2.5% | 1,042 | 968 | -7.1% |
*Data as of September 2012.
Note: Year-to-date reflects January to September data.
Source: IBRC, using Indiana Association of Realtors data
Conclusion
The outlook is sluggish for 2013, but the Lafayette MSA will continue its incremental increases in population, income, jobs, wages and even in the housing market. Housing trends indicate that the industry may have turned a corner and those ripple effects within the economy would be a welcome boost to the region. However, the fiscal cliff will cause businesses to be cautious and its outcome could certainly derail any anticipated momentum.
Notes
- The uptick in unemployment in June and July 2012 mirrors the recurring trend seen in 2009 to 2011, likely attributed to the change in labor force needs due to students leaving the area during summer break.
- Tim Slaper and Ryan Krause, “Occupational Hazard: Why Indiana’s Wages Lag the Nation,” Indiana Business Review 85 (Spring 2010), www.ibrc.indiana.edu/ibr/2010/spring/article1.html.
Also in this Issue…
- International Outlook for 2013
- U.S. Outlook for 2013
- Financial Outlook for 2013
- Indiana's Outlook for 2013
- Indiana's Agricultural Outlook for 2013
- Three Key Indicators—Forecasts for Jobs, Income and Productivity
- Anderson Forecast 2013
- Bloomington Forecast 2013
- Columbus Forecast 2013
- Evansville Forecast 2013
- Fort Wayne Forecast 2013
- Gary Forecast 2013
- Indianapolis-Carmel Forecast 2013
- Lafayette Forecast 2013
- Louisville Forecast 2013
- Muncie Forecast 2013
- Richmond Forecast 2013
- South Bend and Elkhart Area Forecast 2013
- Terre Haute Forecast 2013