Income Inequality
Assistant Professor of Sociology, Grinnell College
Income inequality is a growing problem across the United States, and this article considers differences among states between 2002 and 2007—the last period of economic expansion. Specifically, this research focuses on the 90/10 income inequality ratio—the wage or salary income earned by individuals at the 90th percentile (those earning more than 90 percent of other workers) compared to the earnings of workers at the 10th percentile (those earning higher than the bottom 10 percent).
Morris and Western document that U.S. income inequality rose tremendously between the early 1970s and the close of the 20th century as income for people earning at the 70th percentile or lower declined while earnings near the top of the income distribution grew substantially in real value.1 This trend is problematic since researchers find that increasing levels of inequality can reduce economic mobility as well as civic engagement and life satisfaction.2
As the United States currently regains economic strength after the 2008 recession, it is useful to look back to the last growth period to see which states had worsening income inequality and which were able to reduce this problem. This article measures disparities in income from the 2001 recession through 2007 using wage data from the Current Population Survey.3 It considers differences between women and men across the U.S. who were employed full-time. While income inequality ratios fluctuate widely from year to year, these analyses depend on regression-based coefficients that estimate whether there is a statistically significant trend over the complete six-year period.
Overall Income Inequality Trends
The first step in understanding inequality trends is to consider changes at the bottom and top of the income distribution. Figure 1 demonstrates that, across the United States, workers at the 10th percentile saw their incomes largely stagnate at roughly $16,500 per year between 2001 and 2007. This nearly flat income level is observed despite a noticeable bump in 2007 that may be due to the first stage of the three-part federal increase in the minimum wage. However, on average, states saw a significant decrease in their 10th percentile income levels—a drop from $17,100 in real value in 2005 to $16,750 by 2007. This strongly suggests that while most states had constant wages for this low-wage bracket, some experienced sharp decreases.
Figure 1: U.S. and Average State 10th Percentile Trends, 2001 to 2007
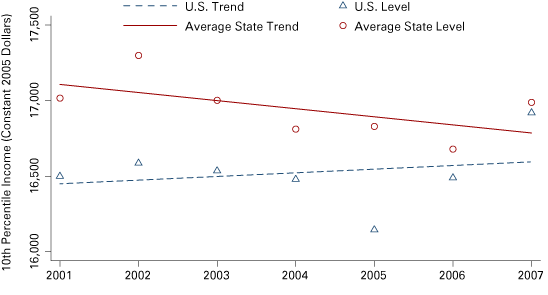
Note: The U.S. trend is not statistically significant at the p<0.1 level.
Source: Author’s calculations, using data from the Integrated Public Use Microdata Series of the Current Population Survey (IPUMS-CPS)
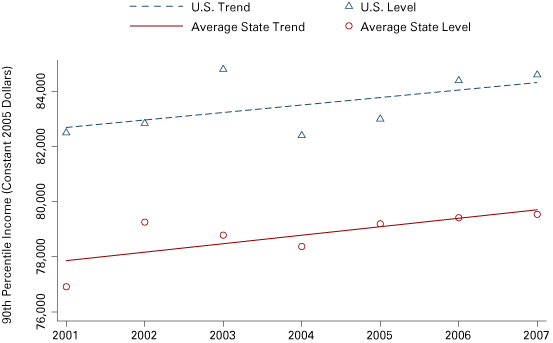
Meanwhile, near the top of the income distribution, workers at the 90th percentile experienced significant improvements in their wage levels (see Figure 2). Across the U.S., 90th percentile earners started this period earning $82,800 per year and ended near $84,500. Despite substantially lower wage levels in some states, this trend of increasing income is also true among states since their average 90th percentile level also increased noticeably between 2001 and 2007—from $77,900 to $79,700.
Figure 2: U.S. and Average State 90th Percentile Trends, 2001 to 2007
Source: Author’s calculations, using data from the Integrated Public Use Microdata Series of the Current Population Survey (IPUMS-CPS)
Dividing the income of workers at the 90th percentile with those of workers at the 10th percentile creates the 90/10 income inequality ratio to demonstrate inequality trends from 2001 to 2007. Despite the noted increase in wages for workers at the 90th percentile across the U.S., their income stayed at roughly five times the amount earned by workers at the 10th percentile throughout this period (see Figure 3). However, owing to the significantly different income trends of workers at the 90th and 10th percentile among several individual states, there is a significant increase in the average state’s income inequality. States started this period with an average 90/10 income inequality ratio of 4.56 which grew to 4.76.
Figure 3: U.S. and State Income Inequality Trends by Sex, 2001 to 2007
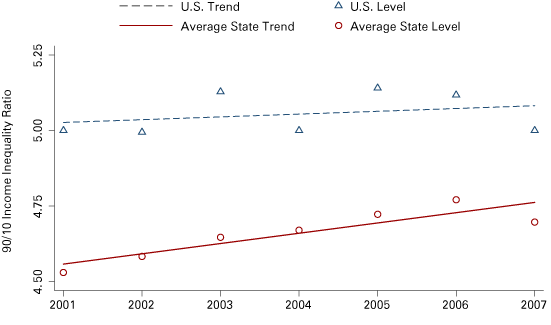
Note: The U.S. trend is not statistically significant at the p<0.1 level.
Source: Author’s calculations, using data from the Integrated Public Use Microdata Series of the Current Population Survey (IPUMS-CPS)
Differences between States for Women and Men
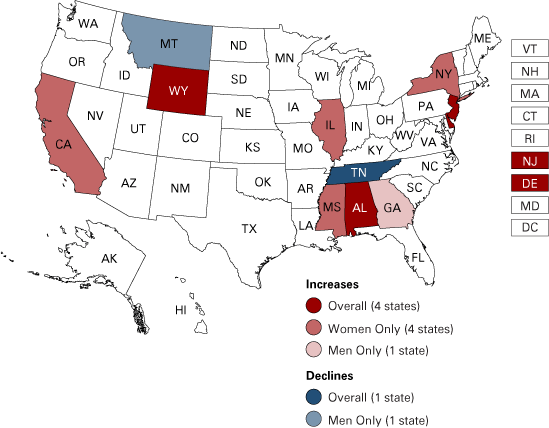
While Indiana did not show a significant change in overall income inequality during this relatively short six-year period, four states demonstrated significant increases: Alabama, Delaware, New Jersey and Wyoming (see Figure 4). Income disparities grew the most in Delaware where earners at the 90th percentile earned an estimated 4.29 times more than workers at the 10th percentile in 2001 but this ratio increased to over 5 by 2007. Among states with larger workforces, New Jersey’s already high 5.36 income inequality ratio grew to 5.78. Considering differences among women and among men, four states had worsening inequality for female workers (California, Illinois, Mississippi and New York), while Georgia had growing levels of inequality among men.
Figure 4: Inequality Trends by State among All Workers, 2001 to 2007
Source: Author’s calculations, using data from the Integrated Public Use Microdata Series of the Current Population Survey (IPUMS-CPS)
The only state that had a significant decrease in overall income inequality was Tennessee, which had a low 4.65 income inequality ratio in 2001 and reduced this ratio even further to 4.25 by 2007. This trend of lowering inequality, however, is largely due to the lack of income growth for Tennessee’s 90th percentile earners. Montana showed improvement in income inequality but only among male workers such that men at the 90th percentile initially earned 4.13 times the income of their counterparts at the 10th percentile but this ratio decreased to 3.62 at the end of this period.
Worsening inequality primarily occurred for female workers over this period of economic expansion, exemplified by California. Nationally, women earning at the 90th percentile during the 2001 recession made 4.26 times the income of their counterparts at the 10th percentile nationally but this ratio grew to 4.59 by 2007 (see Figure 5). California’s income inequality ratio grew from an already high 4.72 all the way to 5.51 by 2007. Also notable is that Illinois’ relatively low inequality level of 4.05 grew to 4.51 in these six years. Indiana bucked the overall pattern by staying at a relatively low income inequality ratio (around 3.64) so that wages among women in the state were among the most equitable in the nation by the end of the period.
Figure 5: U.S. versus State Inequality Trends, Female Workers, 2001 to 2007
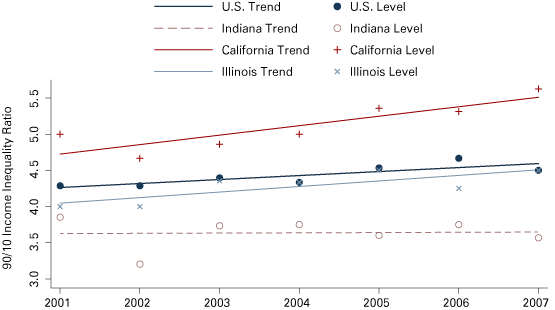
Note: The Indiana trend is not statistically significant at the p<0.1 level.
Source: Author’s calculations, using data from the Integrated Public Use Microdata Series of the Current Population Survey (IPUMS-CPS)
Among men, the insignificant increase in income inequality across the U.S. obscures the worsening inequality trends among several individual states. Among men, wage earners at the 90th percentile started the period with salaries about 5.3 times larger than men at the 10th percentile and this ratio stayed relatively constant for six years (see Figure 6). However in Alabama, the 90/10 income inequality ratio was just over 4 in 2001 but grew rapidly to 5.65 in just six years. The income inequality among men in the larger New Jersey workforce was already a high 5.62 at the start of the period then rose to 6.55. Indiana was not among the states with worsening inequality and its pattern over this time even suggests a slight decline down to 4.1, though this trend is not statistically significant.
Figure 6: U.S. versus State Inequality Trends, Male Workers, 2001 to 2007
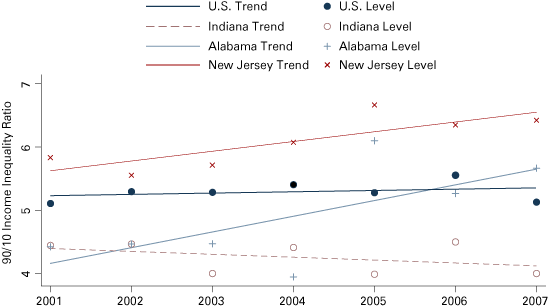
Note: The Indiana trend is not statistically significant at the p<0.1 level.
Source: Author’s calculations, using data from the Integrated Public Use Microdata Series of the Current Population Survey (IPUMS-CPS)
Causes of Growing Income Inequality
While six years is a relatively short period for tracking income inequality, it is important to note that several states still had worsening inequality during the 2002-2007 economic expansion even though Indiana remained relatively constant. There is considerable debate among economists on whether economic growth is more likely to benefit higher income earners instead of equally improving the lot of all workers. Research by Hasanov and Izraeli reveals a complex relationship between income inequality and economic growth in which they find that economic growth should affect all income earners equally, yet worsening income inequality can reduce future economic growth.4
It is therefore important to examine the range of other social and economic factors and government policies that can affect income inequality. Hasanov and Izraeli find that education, training and labor market policies are key for improving the share of income earned by workers at the bottom of the income distribution. Preliminary analysis of additional factors suggest that states with higher inequality do not necessarily have greater economic strength but have higher proportions of minority and foreign-born workers, lower minimum wage levels and lower proportions of workers in the accommodation and food service industry.
Notes
- Martina Morris and Bruce Western, “Inequality in Earnings at the Close of the Twentieth Century,” Annual Review of Sociology 25 (1999):623-657.
- For a broad review of the consequences of rising income inequality in the United States, please see: Larry M. Bartels, Unequal Democracy (Princeton, NJ: Princeton University Press and Russell Sage Foundation, 2008).
- Miriam King, Steven Ruggles, J. Trent Alexander, Sarah Flood, Katie Genadek, Matthew B. Schroeder, Brandon Trampe and Rebecca Vick, "Integrated Public Use Microdata Series, Current Population Survey: Version 3.0 [Machine-Readable Database]" (Minneapolis: University of Minnesota, 2010).
- Fuad Hasanov and Oded Izraeli, "Income Inequality, Economic Growth, and the Distribution of Income Gains: Evidence from the U.S. States," Journal of Regional Science 51, no. 3 (2011): 518-39.
Also in this Issue…


