Indiana's Ongoing Foreclosure Crisis
Economic Research Analyst, Indiana Business Research Center, Kelley School of Business, Indiana University
Many areas of the economy are finally showing signs of life. Here in Indiana, labor force data from March show that Hoosier employers added more than 50,000 jobs over the preceding 17 months and the state's unemployment rate was at its lowest point since late 2008. Despite this momentum in the broader economy, the housing market continues to struggle and its near-term direction seems as uncertain as ever.
Mortgage delinquencies and foreclosures are at the heart of the enduring housing troubles. This article will explore mortgage delinquency trends in Indiana and around the country and consider the factors that have fueled this crisis and why Indiana's historic foreclosure trend often deviates from that of the United States. Also, we will examine the impact of this issue on other aspects of the housing market and economy.
Foreclosures at Record Levels
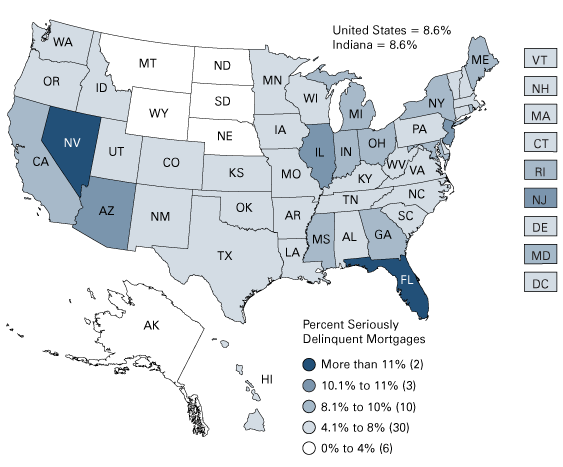
States like Florida, Nevada and California have grabbed most of the national headlines concerning the housing bust and for good reason. As of the fourth quarter of 2010, Florida led the nation with over 19 percent of its mortgages being seriously delinquent (i.e., 90 or more days overdue or in foreclosure) followed by Nevada at 17 percent (see Figure 1). New Jersey, Illinois and Arizona also had marks above 10 percent. At the same time, Indiana's serious delinquency rate of 8.6 percent matched that of the United States and ranked 10th highest nationally, coming in just below Ohio and Michigan.
Figure 1: Share of Seriously Delinquent Mortgages, 2010:4
Source: IBRC using National Delinquency Survey, Mortgage Bankers Association data
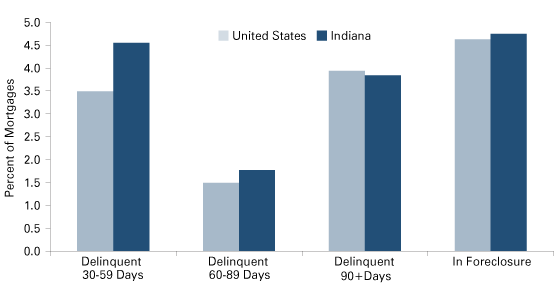
While Indiana and the United States have a comparable share of mortgages that are seriously delinquent, the state has typically had a higher rate of loans in the early stages of delinquency. As of the fourth quarter of 2010, 6.3 percent of all Indiana home loans were up to three months past due compared to 5 percent nationally (see Figure 2). The United States had a slightly higher rate of mortgages 90 or more days delinquent while the share of Indiana mortgages in foreclosure (4.8 percent) edged the U.S. mark (4.6 percent). These foreclosure rates are the highest on record for both Indiana and the nation. All told, 14.9 percent of Indiana mortgages were past due or in foreclosure at last measure compared to 13.6 percent nationally.
Figure 2: Percent of Mortgages in Various Stages of Delinquency, 2010:4
Source: IBRC using National Delinquency Survey, Mortgage Bankers Association data
Trends
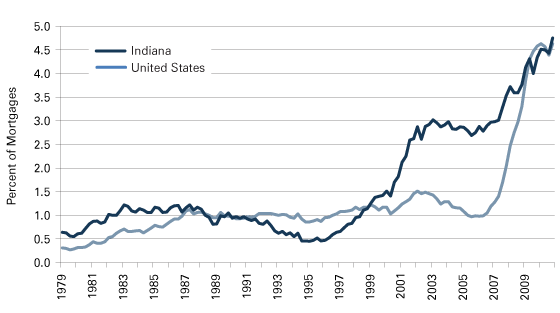
Although Indiana and the United States currently have comparable foreclosure rates, the state's trend over the last two decades has rarely tracked the national rate. Indiana's foreclosure rate was well below the U.S. mark through much of the 1990s. At the low point from mid-1994 to mid-1996, Indiana's foreclosure rate averaged 0.5 percent compared to 0.9 percent for the United States (see Figure 3).
Figure 3: Share of Mortgages in Foreclosure, 1979:1 to 2010:4
Source: IBRC using National Delinquency Survey, Mortgage Bankers Association data
Indiana's rate began to rise steadily in late 1996 and truly soared, along with unemployment rates, at the onset of the recession in the early 2000s. The recession spurred an increase in the U.S. foreclosure rate too, but not to the extent seen in Indiana. More importantly, through the mid 2000s, the U.S. rate gradually returned to the 1 percent level while Indiana's remained elevated. However, the housing bust and ensuing economic downturn have pushed the U.S. rate up more than four-fold since 2007.
Driving Forces
In a 2009 report to Congress, the Department of Housing and Urban Development outlined several factors that contributed to the recent foreclosure situation.1 Listed among the underlying causes were slowing home price appreciation and, later, the weak economy. Yet while these factors helped to spark the recent rise in mortgage defaults, the growth in high-risk loans provided the primary fuel for the crisis.
The rise of subprime lending around 2003 certainly headlined this development and Hoosiers have been more likely to enter the subprime market than Americans have on whole. By 2006, more than 15 percent of Indiana's home loans were subprime compared to 13.5 percent for the nation, according to the Mortgage Bankers Association. In Indiana, this mark has dropped to roughly 11 percent in 2010 while the U.S. stands below 10 percent. As of late 2010, one quarter of Indiana's subprime loans were seriously delinquent.
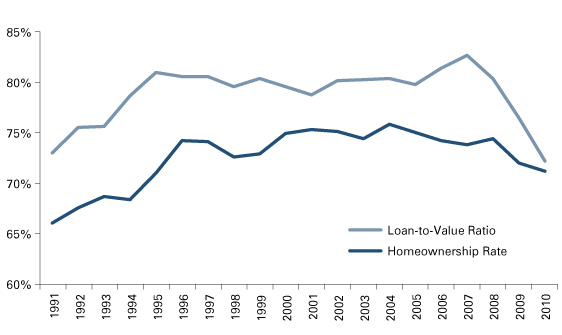
The loosening of lending standards began before the boom in subprime loans, however. Federal Housing Finance Agency (FHFA) data show that Indiana's average mortgage loan-to-home value (LTV) ratio jumped from 73 percent in 1991 to 81 percent in 1995. Indiana's ratio hovered around the 80 percent mark through 2008 but has dropped precipitously since. Even more telling, Indiana's LTV ranking went from 12th lowest among states in 1991 to 34th in 1995. Each year between 2003 and 2006, Indiana had one of the 10 highest ratios in the nation.
This easier access to credit no doubt helped to make the dream of owning a home a reality for many Hoosiers (see Figure 4). Indiana's homeownership rate rose from 66 percent in 1991 to 76 percent in 2004, the fifth largest increase in the nation over this period. The U.S. rate also peaked in 2004 at 69 percent, up 5 percentage points over 1991. These lax lending standards, however, also meant that there were more homeowners unprepared for the type of economic shocks associated with the housing bust and ensuing recession. As a result, foreclosures have soared and homeownership is in retreat. Indiana's 2010 homeownership rate is down to 71 percent, its lowest point since 1995.
Figure 4: Indiana Loan-to-Value Ratio and Homeownership Rate
Source: IBRC using Federal Housing Agency and U.S. Census Bureau data
While the growth of high-risk lending fueled the national foreclosure crisis that began in 2007, this factor alone does not explain Indiana's elevated default rate earlier in the decade. Other structural dynamics left Hoosiers more susceptible to foreclosure. Chief among these has been the state's sustained industrial decline.
After expanding through the 1990s, Indiana shed more than 220,000 manufacturing jobs between 2000 and 2009. Roughly half of those losses came before the recession hit in late 2007. Other jobs have cropped up to offset a portion of these manufacturing losses, but they have tended to be in lower wage industries. This shift has contributed to a steady slide in household incomes. From its peak in 1999, Indiana's real median household income dropped by a rate of 1 percent per year through 2007 — ranking Indiana 44th among all states. The recent downturn forced the state's real median household income down at an even faster rate.
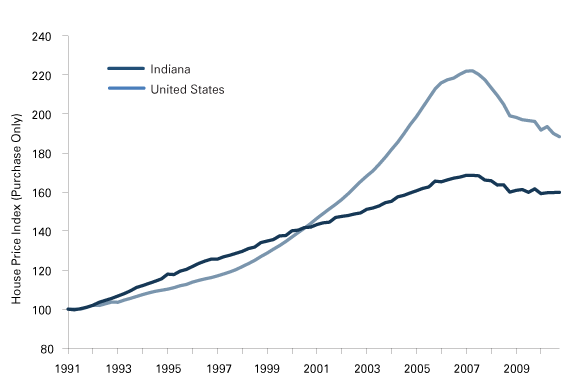
As it relates to foreclosures, the decline in real household incomes was compounded by the state's slow rate of housing appreciation. According to the FHFA's House Price Index, Indiana housing appreciated 69 percent from 1991 to its peak in 2007 (see Figure 5). This was the slowest 1991-to-peak increase of any state. Ranking just ahead of Indiana were Ohio (75 percent increase to its peak in 2006), Texas (92 percent) and Kentucky (93 percent).
Figure 5: House Price Index, Indiana and the United States, 1991:1 to 2010:4
Source: IBRC using Federal Housing Finance Agency data
When looking at changes in home values, it's reasonable to question whether Indiana was even part of the housing bubble. After all, the state's home prices did little more than keep pace with nominal growth in household incomes over the last two decades.
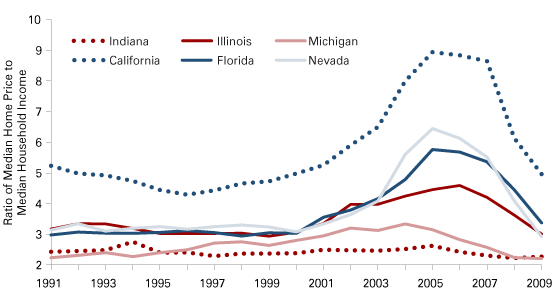
Figure 6 traces the ratio of nominal median household income to median home sales price for select states. This analysis shows that although many states experienced a run up in home prices relative to incomes in the early 2000s, California, Nevada and Florida truly led this trend. The price-to-income ratios in Florida and Nevada more or less doubled between 2000 and 2005 while prices in California soared to nine times its median household income. Among some of Indiana's neighbors, Illinois also saw a significant jump in this measure and even struggling Michigan's ratio climbed modestly.
Figure 6: Ratio of Median Home Price to Median Household Income, Indiana and Select States, 1991 to 2009
Source: IBRC using U.S. Census Bureau and Moody's Economy.com data
Since the onset of the housing crisis, however, the price-to-income ratio in each of these states tumbled back to the more sustainable levels seen during the 1990s. All the while, Indiana's ratio held steady rising just two-tenths of a percentage point between 2000 and 2005— a smaller increase than all but four states. Indiana's ratio has come down as both prices and nominal median household incomes have dipped in recent years. Indiana, Ohio and Michigan had the nation's lowest price-to-income ratios in 2009.
In many parts of the country, these rapid price increases during the bubble period rescued many homeowners who were in over their heads. In the event of economic hardship, many people could take advantage of their inflated home values to refinance or sell their homes at prices that allowed them to avoid foreclosure. By contrast, the lack of a price bubble in Indiana meant that fewer Hoosiers had this option.
Not until the bubble began to deflate in 2006 did many homeowners around the country begin to fall victim to the same circumstances that had plagued many Hoosiers for several years prior: too many high-risk loans that were no longer cloaked by rapid price increases.
It's important to note that Indiana was not alone in its lofty foreclosure rates before the bust. Neighboring Michigan, Ohio and Illinois joined Indiana to form a distinct block of high foreclosure states. Each of these states, to some degree, shared the same mix of factors that drove Indiana's trend.
Implications
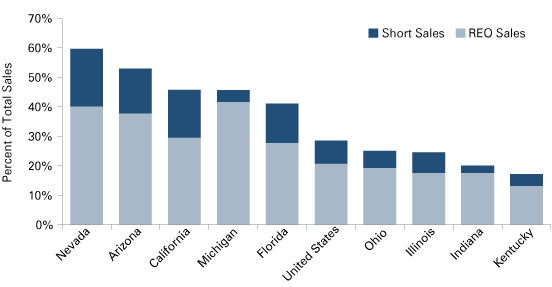
The foreclosure fallout has led to a glut of distressed properties on the market. The real estate analytics firm CoreLogic estimates that distressed sales, comprising both real estate owned (REO) sales and short sales, jumped from 6 percent of all U.S. transactions in 2007 to 28 percent in 2009.2 This measure reached 30 percent by November 2010.3
Among states, the usual suspects lead the way. Distressed properties made up over half of all sales in Michigan, Nevada and Arizona in November 2010, followed by California and Florida with marks above 35 percent (see Figure 7). Distressed sales accounted for nearly one out of every five homes sold in Indiana in November 2010. This value ranks 21st nationally and is well below the U.S. average.
Figure 7: Distressed Home Sales as a Share of Total Sales, United States and Select States, November 2010
Source: IBRC using CoreLogic data
The flood of distressed properties on the market has a couple of damaging side effects. First, the elevated inventory of distressed homes places downward pressure on prices. This effect varies widely between local markets yet it is clearly a major force behind continued price declines in some areas and a weight on price rebounds in others. Moreover, working through the inventory of distressed properties is, in some ways, perpetuating the housing crisis. That is, more and more homeowners become at risk of foreclosure as prices continue to decline (or simply tread water) and the employment situation is slow to rebound.
The large inventory of distressed properties has also helped to undercut demand for new homes. This is a trend that the economics blog Calculated Risk has termed the "distressing gap." Over at least a dozen years leading up to the housing bust there was a consistent ratio of five to six existing home sales for each new home sold at the national level. Since the beginning of 2007, however, the housing demand that still exists has tilted even more heavily toward increasingly affordable existing homes. As a result, the ratio of existing home sales to new homes climbed to 17 by early 2011. This widening gap is at least partially explained by the decline in existing home prices driven by the large inventory of distressed properties.4
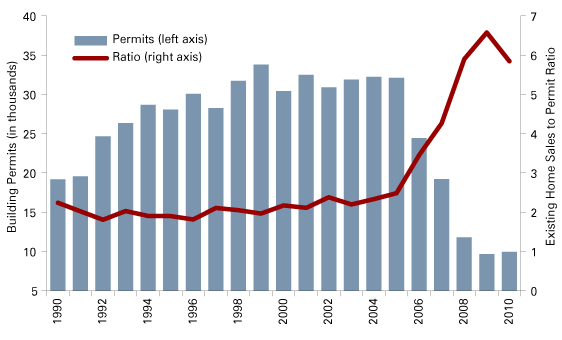
New home sales data are not available for states so we are unable to confirm if this relationship holds in Indiana. However, a comparison of existing home sales and annual building permits suggests that the same dynamics are at play (see Figure 8).5 From 1990 to 2005, approximately two existing homes were sold for each single-family building permit issued in Indiana. Even through the 1990s when the number of annual permits increased by 15,000, there was a corresponding increase in existing home sales. Since 2006, the number of building permits issued has plummeted but existing home sales have not dropped in proportion, resulting in a ratio that approached seven in 2009. Presumably, distressed-sales-induced price declines for existing homes contributed to this moribund market for new homes.
Figure 8: Indiana Annual Single-Family Building Permits and Ratio of Existing Home Sales to Single-Family Building Permits
Source: IBRC using U.S. Census Bureau, Moody's Economy.com, and Indiana Association of Realtors data
This measure declined some in 2010 as existing home sales continued to slide while single-family permits ticked up slightly. The increased permits, however, were likely a temporary product of the federal government's homebuyer tax credit programs of 2009 and 2010. As of April, the number of permitted units in Indiana has declined year-over-year in ten of the last 11 months.
Conclusion
The Indiana housing market will continue to face challenges. The state's foreclosure rate at the end of 2010 was at a historic high and could remain elevated for some time judging by the share Indiana mortgages that are still under water. According to CoreLogic, 11 percent of the state's mortgages were in a negative equity position in the fourth quarter of 2010. Another 5 percent were near negative equity (i.e., the outstanding mortgage is at least 95 percent of the home value). These figures are well below the U.S. average but they do suggest that there remains a sizeable pool of Hoosier homeowners who are at risk of foreclosure.
However, Indiana will eventually work through this crisis, as will the rest of the country. The state's swollen inventory of distressed homes will shrink and the value of Indiana homes will appreciate once again. For Hoosiers, though, the sobering question becomes: what then? We already saw that Indiana had one of the nation's highest foreclosure rates for several years before the housing bust. After the market recovers, will the economic fundamentals that created that environment continue or will Indiana see the economic development it needs to reverse its decade-long slide in household incomes? Indiana will need a retooled economy to ensure that it does not spend another decade among the top foreclosure states.
Notes
- "Report to Congress on the Root Causes of the Foreclosure Crisis," U.S. Department of Housing and Urban Development, January 2010.
- Real estate owned refers to properties that are owned by lenders after an unsuccessful foreclosure auction. A short sale is the sale of a home at a price that is less than the outstanding mortgage.
- "U.S. Housing and Mortgage Trends," CoreLogic, February 2011, www.corelogic.com/#home-research.
- "Home Sales: Distressing Gap," Calculated Risk (blog), February 24, 2011, www.calculatedriskblog.com/2011/02/ home-sales-distressing-gap.html.
- Admittedly, building permits is a crude proxy for new home sales. Other factors such as overbuilding prior to 2006 may contribute to the drop in building permits as well. However, the trend line in Figure 8 mirrors the trend line for the U.S. ratio of existing home sales to new home sales over this same period.
Also in this Issue…


