South Bend and Elkhart Area Forecast 2012
Chair and Professor of Economics, School of Business and Economics, Indiana University South Bend
The Michiana region, comprised largely of the South Bend-Mishawaka and Elkhart-Goshen metropolitan statistical areas (MSAs), continues to recover from the significant setbacks resulting from the 2007–2009 recession. We expect the recovery to continue in 2012 but at a slow pace.
Gross Domestic Product
The combined local real gross domestic product (RGDP) was $19.45 billion (in chained 2001 dollars) in 2010. Separately, the 2007–2009 recession caused Elkhart-Goshen MSA’s RGDP to contract 15.3 percent, while the South Bend-Mishawaka MSA shrank by 6.9 percent. By the end of 2010, and with RGDP of $8.81 billion, the Elkhart-Goshen MSA grew 13 percent, while the South Bend-Mishawaka MSA area ($10.65 billion) grew about 1 percent from the previous year. By the end of 2010, the Elkhart-Goshen area experienced the largest upturn in RGDP growth in the nation. Thanks to a strong recovery in the metro’s durable goods manufacturing, it went from a 15.3 percent decline in 2009 to 13 percent growth in 2010—an impressive gain of 28.3 percentage points. The South Bend-Mishawaka metropolitan area’s RGDP grew about 1.0 percent in 2010 after declining 6.9 percent in 2009—a turnaround of 8 percentage points. Overall, the size of the local metropolitan economies, while higher in 2010 than its level in 2009, remained $1.1 billion (in chained 2001 dollars) below pre-recession levels.
Labor Force and Employment
The local labor force continued to decline but at a slower rate, with a decline of about 1,500 between September 2010 and September 2011. This is compared to a drop of 6,500 workers between September 2009 and September 2010. This improvement is unevenly distributed between the two metropolitan areas. From September 2010 to September 2011, the South Bend-Mishawaka MSA labor force declined by 60 people, while the Elkhart-Goshen MSA labor force fell by 1,434.1 Combined employment for both metros fell by 1,400 from 239,700 jobs in September 2010 to 238,300 in September 2011. The Elkhart-Goshen MSA lost 1,800 jobs, while the South Bend-Mishawaka MSA gained 500 more jobs during the same period. However, between the first quarter of 2010 and the same quarter of 2011, the Elkhart area had the largest percent gain in the nation (6.2 percent).
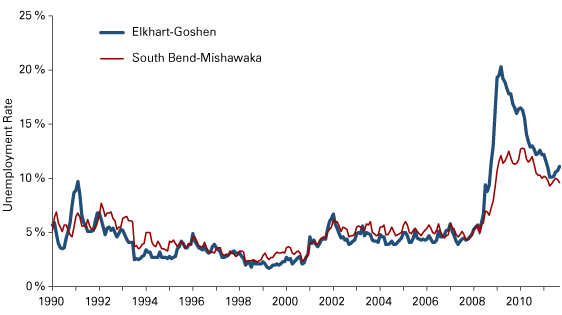
Figure 1 shows metropolitan unemployment rates for 1990 to 2011. For both MSAs, the unemployment rates continued to fall since peaking in 2009. These rates were lower by the third quarter of 2011 than they were in 2009. The economic recovery which began in June 2009 buoyed local economic growth and reduction in unemployment rates across the two metropolitan areas. Elkhart-Goshen’s unemployment rate fell 5.8 points by September 2011 from the September 2009 level of 16.9 percent—a huge 34.3 percent decline. Insulated somewhat by its more diverse economic base, the South Bend-Elkhart MSA experienced only a 1.8 point decline for the same period.
Figure 1: Unemployment Rates in the Elkhart-Goshen and South Bend-Mishawaka MSAs, January 1990 to September 2011

Source: STATS Indiana, using Bureau of Labor Statistics data
Table 1 reports employment data by industry for the region’s metropolitan areas. The Michiana region has lost a staggering number of jobs as a result of the recession that officially began in the fourth quarter of 2007 and ended in June 2009. Approximately 228,400 people were employed in non-farm sectors across the region in September 2011, with employment being about 29,800 higher in the South Bend-Mishawaka area compared to Elkhart-Goshen. From September 2010 to September 2011, total non-farm employment fell by 1,800 jobs in the Elkhart-Goshen MSA, while rising by 500 jobs in the South Bend-Mishawaka MSA.
Table 1: Employment by Industry and Metro Area, September 2011
| Industry | Elkhart-Goshen | South Bend-Mishawaka | Combined Region | ||||
|---|---|---|---|---|---|---|---|
| Employment | Change since September 2010 | Employment | Change since September 2010 | Employment | Change since September 2007 | Change since September 2010 | |
| Total Non-Farm | 104,300 | -1,800 | 134,100 | 500 | 238,400 | -38,700 | -1,300 |
| Natural Resources, Mining and Construction | 3,700 | 300 | 4,900 | 200 | 8,600 | -2,500 | 500 |
| Manufacturing | 45,800 | 900 | 15,900 | -100 | 61,700 | -20,600 | 800 |
| Trade, Transportation and Utilities | 15,500 | -900 | 26,200 | 600 | 41,700 | -5,300 | -300 |
| Information | 600 | 0 | 1,700 | 100 | 2,300 | -600 | 100 |
| Financial Activities | 2,900 | -100 | 6,000 | 200 | 8,900 | -1,300 | 100 |
| Professional and Business Services | 7,300 | -200 | 13,700 | 800 | 21,000 | -2,300 | 600 |
| Private Educational and Health Services | 10,500 | -500 | 31,800 | -1,200 | 42,300 | -1,800 | -1,700 |
| Leisure and Hospitality | 6,300 | -400 | 12,400 | 500 | 18,700 | -1,500 | 100 |
| Other Services | 3,200 | -300 | 5,400 | 100 | 8,600 | -1,200 | -200 |
| Government (Includes Public Schools and Hospitals) | 8,500 | -600 | 16,100 | -700 | 24,600 | -1,600 | -1,300 |
Source: Bureau of Labor Statistics
While jobs in the two metropolitan areas were down 38,700 from where they were in September 2007, a look at more recent data shows some positive signs. The combined total non-farm jobs were down 1,800 compared to their 2010 levels. That may not sound all that positive unless one considers that non-farm employment dropped 6.5 percent from 2007 to 2008 and 10.4 percent from 2008 to 2009 (using September data from each year). It looks like the worst may be behind us and job losses may be moderating. In the most recent data, some individual industries saw positive signs as well. While all industries experienced losses from September 2009 to September 2010, only four industries in the combined area experienced job losses over the past year—trade, transportation and utilities; private educational and health services; other services; and government. On the other hand, manufacturing; professional and business services; and natural resources, mining and construction recorded healthy gains. Also, there were modest job gains in information and financial services during the period.
All of the 900 manufacturing industry gains resulted from more jobs in the Elkhart-Goshen MSA, and all the jobs in professional and business services added since 2010 were a result of gains in the South Bend-Mishawaka MSA alone. This metro area added 600 jobs in trade, transportation and utilities, 500 in leisure and hospitality, 200 in financial activities, while the Elkhart-Goshen MSA lost 900, 400, and 100 jobs in these industries, respectively, from September 2010 to September 2011. Job losses in private educational and health services were more pronounced in South Bend-Mishawaka with 1,200 losses compared to Elkhart-Goshen with 500 job losses. Both MSAs share the combined government sector job losses almost equally, with 700 jobs losses in South Bend-Mishawaka and 600 job losses in Elkhart-Goshen.
Local Wages
From March 2010 to March 2011, the average weekly wage rose by 5.7 percent to $698 in Elkhart compared to a gain of 3.4 percent from March 2009 to March 2010. In the South Bend-Mishawaka metropolitan area, the average wage climbed 3.1 percent to $723, compared to a decline of 2.2 percent during the previous period. This positive wage trend should continue as both local economies continue their recovery and see improving labor markets.
Housing
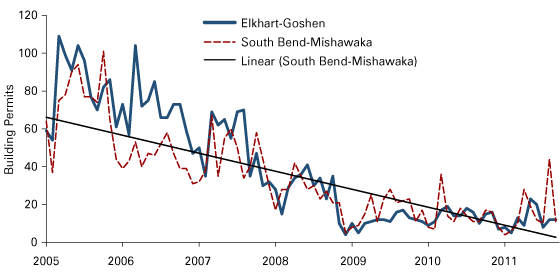
Residential construction, measured by the number of new single-dwelling housing permits issued in the combined MSAs moderately improved. From January to September 2011, the Elkhart-Goshen MSA had 110 single-family building permits filed. This number is lower than its January-to-September 2010 number of 128 (see Figure 2). At the same time, the South Bend-Mishawaka MSA had more single-family building permits (144) filed through September of 2011 compared to the same period in 2010 (130). Indiana Association of Realtors® data also indicate some improvement in the housing sector of both metropolitan areas. Median home prices jumped 13.9 percent in Elkhart-Goshen (from $86,500 in September 2010 to $98,500 in September 2011), while rising 3.7 percent during the same period in South Bend-Mishawaka (from $107,000 to $111,000). In addition, the inventory of homes for sale declined 7.7 percent in the Elkhart-Goshen region and 0.8 percent in the South Bend-Mishawaka MSA during the period. If these patterns continue, the region should experience a modest growth in housing demand as the local economy continues to expand, financial markets stabilize, bank credit and lending restrictions ease, and local labor markets improve.
Figure 2: Single-Family Residential Building Permits by Metropolitan Areas, January 2005 to September 2011

Source: U.S. Census Bureau
Summary
The Michiana region continued its slow but steady recovery from the crippling 2007–2009 recession that caused significant job loss, high unemployment rates, falling real wages on average and weak new home construction. However, 2011 showed some encouraging signs, with real gross domestic product of the local economy rising, declining (though elevated) unemployment rates and real wages expanding in certain sectors. The outlook for 2012 is guardedly optimistic.
Looking ahead, we are beginning to see some increased business growth and expansions like Shafer-Gear, Bright Automotive, Development Partners, Hydro Alumni Co, Inovateus, and others that have added jobs in the South Bend-Mishawaka MSA with more jobs coming in 2012. The same is happening in Elkhart-Goshen’s business friendly environment, where new and expanding manufacturers like Eterniti, Lippert Components and Kinro Manufacturing, Redwood RV, Electronic Commerce Inc., Molden Foam LLC and others have added several hundred jobs. Overall, the Michiana region’s unemployment rates should continue to fall below current levels, economic activity will quicken, real wages will rise and the housing market will rebound.
References
- Bureau of Economic Analysis. 2011. www.bea.gov/regional/index.htm.
- STATS Indiana. Covered Employment and Wages. 2011. www.stats.indiana.edu/cew/.
- STATS Indiana. Labor Force Estimates Time Series View. 2009. www.stats.indiana.edu/laus/laus_view3.html.
- U.S. Bureau of Labor Statistics, County Employment and
Wages–First Quarter 2010.
www.bls.gov/news.release/archives/cewqtr_10192010.pdf. - Indiana Association of Realtors®. Indiana Housing Market Update, 2011.
- www.10kresearch.com/reports/IAR/Main.htm.
Also in this Issue…
- Outlook for 2012
- International Outlook for 2012
- U.S. Outlook for 2012
- Financial Outlook for 2012
- Housing Market Outlook for 2012
- Indiana's Outlook for 2012
- Indiana's Agricultural Outlook for 2012
- Anderson Forecast 2012
- Bloomington Forecast 2012
- Columbus Forecast 2012
- Evansville Forecast 2012
- Fort Wayne Forecast 2012
- Gary Forecast 2012
- Indianapolis-Carmel Forecast 2012
- Kokomo Forecast 2012
- Lafayette Forecast 2012
- Louisville Forecast 2012
- Muncie Forecast 2012
- Richmond Forecast 2012
- South Bend and Elkhart Area Forecast 2012
- Terre Haute Forecast 2012


