Gary Forecast 2012
Associate Professor of Economics, School of Business and Economics, Indiana University Northwest
The recession that began in December 20071 had a larger impact on employment in Northwest Indiana (-6.6 percent) than it did in the nation (-5.3 percent); Indiana fared somewhat worse than did our region (a 7.9 percent job loss statewide), as shown in Table 1.2 But while employment rose slightly in Indiana after the recession’s trough, it continued to fall significantly in our region, declining by an additional 8,100 jobs between June 2009 and September 2011 (an additional 3.1 percent loss). Unlike the nation and the state, the recovery (such as it is) has not even begun to take hold. Figure 1 shows these changes graphically, with total non-farm employment indexed to January 1990.
Table 1: Employment Changes During and After the Recession, December 2007 to September 2011
| Indicator | Northwest Indiana | Indiana | U.S. |
|---|---|---|---|
| Total Non-Farm Employment, December 2007 | 283,600 | 3,015,700 | 138,875,000 |
| Change in Employment, 12/2007 to 6/2009 | -18,600 | -236,800 | -7,350,000 |
| Percent Change | -6.6% | -7.9% | -5.3% |
| Total Non-Farm Employment, December 2009 | 265,000 | 2,778,900 | 131,525,000 |
| Change in Employment, 6/2009 to 9/2011 | -8,100 | 45,300 | -467,000 |
| Percent Change | -3.1% | 1.7% | -0.4% |
| Total Non-Farm Employment, September 2011 | 256,900 | 2,825,200 | 131,058,000 |
| Change in Employment, 6/2009 to 9/2011 | -26,700 | -190,500 | -7,817,000 |
| Percent Change | -9.4% | -6.3% | -5.6% |
Source: Based on author's calculations
Figure 1: Total Non-Farm Employment Index, January 1990 to September 2011
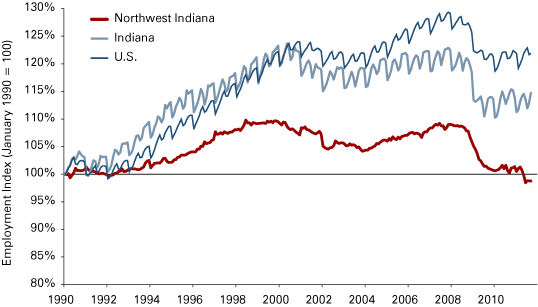
Source: IBRC, using Bureau of Labor Statistics data
Since the national economy passed its trough, employment losses in Northwest Indiana have been concentrated in two industries:
- Manufacturing: It has lost 3,200 jobs, or 9.4 percent, since the trough—nearly as many jobs as were lost during the decline phase of the recession; the steel industry alone has lost that many jobs between June 2009 and September 2011 (-18.9 percent), after losing only 300 jobs during the nationwide downturn.
- Retail Trade: It has lost 2,500 jobs since June 2009 (7.4 percent), following a loss of 3,500 jobs from December 2007 to June 2009.
While the Northwest Indiana economy also lagged the nation in the recoveries from the 1990 and 2001 recessions (with employment declines of 1.4 percent in the early phases of the recovery from the 1990 recession and 2.3 percent early in the 2002–2003 recovery period), the more recent performance of the local economy has been noticeably worse. The continuing decline in retail trade was a distinctive feature of the previous periods as well.
When and Where Will the Recovery in Northwest Indiana Take Hold?
The continuing decline in employment in Northwest Indiana is in large part a consequence of the weakness of the national recovery. Figure 2 shows the relationship between real personal income growth in the nation and employment growth in Northwest Indiana between 1990 and 2011.3 This suggests that employment growth in the Northwest Indiana economy will, on average, be negative until annualized real personal income growth in the nation exceeds 2.58 percent. The discouraging note is that growth in real personal income, far from accelerating, has been slowing over the past seven months. Real personal income had been growing at an annualized rate of around 4 percent from October 2010 to March 2011. Since then, growth has slowed, and in the last two months, the growth rate of real personal income has been only 1.4 percent.
Figure 2: Northwest Indiana Non-Farm Employment Change (%) and U.S. Real Personal Income (%), 1990 to 2011
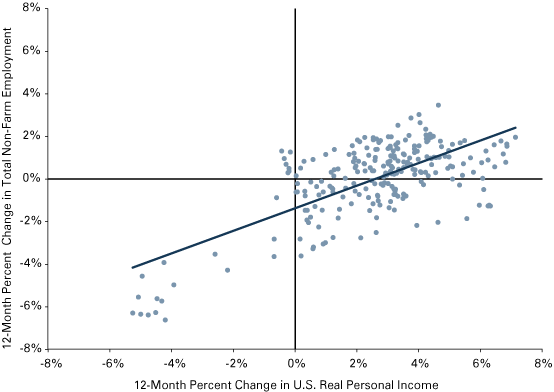
Source: IBRC, using Bureau of Labor Statistics data
National economic forecasts4 have generally begun to suggest slower growth over the next 12 to 18 months, with the average rate of growth in real gross domestic product (GDP) derived from the Federal Reserve Banks of Philadelphia’s survey of forecasters coming in at 2.2 percent—down from the previous estimate of 3.4 percent. Given the historical relationship between changes in real GDP and changes in real personal income,5 this suggests that real personal income will grow at an annualized rate of about 2.7 percent over the next year, suggesting that employment in Northwest Indiana will rise by about 0.03 percent. Essentially, then, the expected increase in national GDP and national real personal income will leave employment levels in Lake and Porter counties unchanged.6
In other words, it does not look like the recovery will really begin in Northwest Indiana until 2013, unless national economic growth exceeds current expectations.
How rapid would national economic growth need to be for employment in Northwest Indiana to grow by 2 percent in the next year? Working backward from our earlier results, it would take growth in real GDP of around 7 percent to generate 2 percent growth in employment in the local economy. This can, I think, be ruled out as a possibility. What about 1 percent growth in employment? That also seems unlikely, as the historical relationships would suggest that GDP growth of about 4.5 percent would be necessary. It seems almost certain, then, that employment growth in Northwest Indiana will be very close to zero in the coming year.
There will be some growth in employment, particularly in health care and construction in Northwest Indiana. However, it appears that will be almost completely offset by employment declines elsewhere. Two sectors—steel and retail—are likely to experience significant declines; employment will decline by about 1,500 jobs in other sectors, but those declines will be fairly evenly spread out (see Table 2).
Table 2: Employment Forecast by Industry, September 2011 to September 2012
| Industry | Change | Percent Change |
|---|---|---|
| Industries With Employment Declines | ||
| Iron and Steel Mills | -500 | -3.6% |
| Retail Trade | -600 | -1.9% |
| Manufacturing, Other than Iron and Steel Mills | -100 to -200 | -0.6% to -1.2% |
| Transportation and Utilities | -100 to -200 | -0.7% to – 1.5% |
| Wholesale Trade | -100 to -200 | -1.1% to -2.3% |
| Financial Activities | -100 to -200 | -1.2% to -2.4% |
| Arts/Entertainment/Recreation | -100 to -200 | -1.4% to -2.9% |
| Hotels/Motels/Eating and Drinking Places | -100 to -200 | -0.5% to -0.9% |
| Local Government (Other than Schools) | -100 to -200 | -0.8% to -1.6% |
| Industries With Employment Increases | ||
| Construction | +1,500 | +8% to +9% |
| Health Care and Social Assistance | 1.1 | 2.7% |
Source: Based on author's calculations
-
Further Declines in Steel. All of the indicators suggest that the average age of motor vehicles in the U.S. has risen to unprecedented levels, which also suggests an upturn in auto sales. Auto sales have increased by 10 percent in the September 2010 to September 2011 period.7 In addition, industrial production has been rising at between 1.5 percent and 2 percent per year for the last two years. This is likely to continue, so it might seem likely that steel output, and thus steel employment, will rise in the coming year. 8 However, our analysis suggests that rising automobile output is associated with lower steel employment. Assuming 10 percent growth in auto production and a 2 percent increase in industrial production, we would predict a continued decline, not an increase in steel employment, with a loss of around 500 jobs.
-
Further Declines in Retail Trade. Income growth in the region is likely to continue to be extremely slow, leading to some additional losses in retail trade—about 600 jobs. This is likely to show up as gains in some parts of the region (south of U.S. 30 and in Porter County) and losses elsewhere.
-
Declines in Other Sectors. Employment declines ranging from 100 to 200 jobs are likely to occur in manufacturing (outside of steel), transportation and warehousing, wholesale trade, financial services, arts/entertainment/recreation, hotels/motels/restaurants/bars, and local government (outside of local public education).
-
Gains in Health Care. The health care sector has grown almost continuously over the past 20 years, and there is no reason to expect this to change. Based on that 20-year pattern of growth (2.7 percent per year), we can expect about 1,100 jobs to be created.
-
Gains in Construction. In percentage terms, construction was the industry that declined the most during the recession; it has recovered mildly since June 2009, adding 1,100 jobs in that two-year period, with 600 in the past year. We can expect this to increase slightly, with construction adding about 1,500 jobs in the coming year.
- Other Industries. Employment in other sectors should be roughly unchanged in the coming year.
Concluding Remarks
The coming year will not look like a recovery in Northwest Indiana. The continuing weakness of national economic growth will, if historical patterns hold, result in essentially no employment growth, although there will be fairly strong growth in construction and health care (which will be offset by declines elsewhere). Fortunately, these gains will be in two of the sectors which pay higher-than-average wages and salaries. For yet another year, the local economy will lag both the state and the nation.
A Personal Consideration
I joined the Kelly School Economic Outlook Panel in 1998, and this year marks my 14th year as a member. It is also my last. I will retire from Indiana University Northwest in May 2012. My time as a member of the Panel has been a central part of my role with IUN and has been one of the things that I have looked forward to most keenly during the year.
The opportunity to meet and talk with so many people each year whose concerns about the future of the local economy have paralleled mine, to be enlightened by their perspectives, and to share with them my insights has given me more pleasure than I know how to express. I have been privileged to be a part of the Economic Outlook Panel, and I wish to thank Morton Marcus (former director) and Jerry Conover (current director) of the Indiana Business Research Center (IBRC). I must also express my appreciation to Carol Rogers and especially to Nikki Livingston (both of the IBRC) whose efforts have made my task much, much easier.
Editor's Note
Dr. Coffin, you will be sorely missed by the thousands of readers and listeners who have appreciated your thoughtful and concise insights into the economy of Northwest Indiana. And I personally will miss you and your gracious sharing of your considerable expertise and wisdom. Thank you!
Notes
- As dated by the National Bureau of Economic Research Business Cycle Dating Committee (www.nber.org/cycles.html).
- All data for Northwest Indiana and the state are drawn from STATS Indiana, a service of the Indiana Business Research Center (www.stats.indiana.edu/). National data can be found at STATS Indiana, on the Bureau of Labor Statistics website (www.bls.gov) or on the website of the Federal Reserve Bank of St. Louis in the FRED database (http://research.stlouisfed.org/fred2/).
- The solid line is based on a regression analysis of the relationship between these two measures:
%ChEmp = -1.37 + 0.53 * (%ChRPI)
(-10.96) (+14.88)
Adj. R2 = 0.471
F = 221.50
t-statistics in parentheses. - For a fairly comprehensive summary of forecasts, see“Third Quarter 2011 Survey of Professional Forecasters,”August 12, 2011, www.philadelphiafed.org/research-and-data/real-time-center/survey-of-professional-forecasters/2011/survq311.cfm.
- According to Reuters, the consensus forecast for the U.S. unemployment rate by the end of 2011 is 9 percent.
- Consistent with the definition of Northwest Indiana used in Table 1.
- Data are from the Federal Reserve Bank of St. Louis FRED Database at http://research.stlouisfed.org/fred2/series/ALTSALES.
- A regression of an index of steel employment on an index of auto production and on an index of industrial output yields the following results (monthly data, using annualized percentage changes for all data):
%ChEmp = -3.69 – 0.17 * %ChAutoProd + 0.31 * %ChIndProd
(14.85) (-6.98) (+4.94)
Adj. R2= 0.157
F = 24.18
t-statistics in parentheses.
Also in this Issue…
- Outlook for 2012
- International Outlook for 2012
- U.S. Outlook for 2012
- Financial Outlook for 2012
- Housing Market Outlook for 2012
- Indiana's Outlook for 2012
- Indiana's Agricultural Outlook for 2012
- Anderson Forecast 2012
- Bloomington Forecast 2012
- Columbus Forecast 2012
- Evansville Forecast 2012
- Fort Wayne Forecast 2012
- Gary Forecast 2012
- Indianapolis-Carmel Forecast 2012
- Kokomo Forecast 2012
- Lafayette Forecast 2012
- Louisville Forecast 2012
- Muncie Forecast 2012
- Richmond Forecast 2012
- South Bend and Elkhart Area Forecast 2012
- Terre Haute Forecast 2012