Fort Wayne Forecast 2012
Director, Community Research Institute, Indiana University-Purdue University Fort Wayne
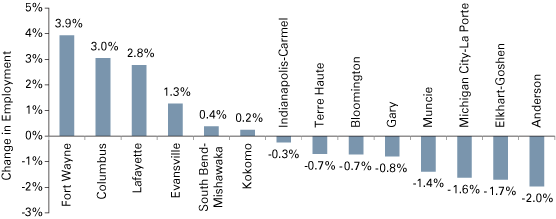
As I began to prepare this review and forecast, the online publication The Fiscal Times reported that the Fort Wayne metropolitan area (MSA)1 led the top 100 metro areas in the nation in net job growth over the past 12 months. This news was certainly a boost to a community that had been hit hard by the Great Recession. The net increase of 8,000 jobs between September 2010 and September 20112 was one of several indicators pointing to a gradual but steady recovery from the low point in the winter of 2009–2010. Major gains were experienced across a wide variety of employment sectors. As illustrated in Figure 1, Fort Wayne also led all Indiana metropolitan areas in job growth during this September to September period, with only the Columbus and Lafayette MSAs even approaching the 3.9 percent increase in employment experienced in Fort Wayne.
Figure 1: Non-Farm Employment Change, September 2010 to September 2011

Note: Data are not seasonally adjusted.
Source: Current Employment Statistics
Based on the most recent non-seasonally adjusted unemployment data provided by the Indiana Department of Workforce Development3 (September 2011), the Fort Wayne MSA is tied with the Indianapolis area for the fourth-lowest unemployment rate among all 16 Indiana metropolitan areas. The current 8.1 percent unemployment rate is a substantial improvement from the 10.4 percent annual average rate for 2010. We must go back to December 2008 to find resident employment in the Fort Wayne MSA as high as the September 2011 level of 195,627. While the Fort Wayne MSA currently represents approximately 7 percent of all statewide employment, the 8,838 net increase in the number of residents employed in the region over the past year represents 24 percent of statewide employment growth.
Another indicator of economic recovery in the Fort Wayne area can be found in the 2010 gross domestic product (GDP) data compiled by the Bureau of Economic Analysis. Total inflation-adjusted GDP in the Fort Wayne metropolitan area increased 5.2 percent between 2009 and 2010. This was more than twice the rate of growth across all U.S. metropolitan areas (2.5 percent). The news in the manufacturing sector was even more encouraging, as the Fort Wayne area experienced a 23.1 percent increase between 2009 and 2010. In Indiana, only the Elkhart-Goshen MSA’s manufacturing sector fared better (an increase of 28.3 percent). Inflation-adjusted manufacturing GDP has never been higher in the Fort Wayne metropolitan area than it was in 2010.
Despite a loss of 5,800 jobs in the manufacturing sector between September 2006 and September 2011, this sector still represents more than 15 percent of all non-farm employment in the Fort Wayne metropolitan area and remains a significant contributor in bringing net new income to the region. However, we still have a long way to go to fully recover from the recent recession. Total employment in the metropolitan area is still down more than 3 percent from the September 2007 level, and manufacturing employment is still down nearly 13 percent.4 The monthly Local Area Unemployment Statistics data series indicates that more than 17,000 area residents are unemployed. While this number is down from a March 2010 high of nearly 24,500, it is still substantially above the 2004–2007 average of 10,640.
Wage levels in Fort Wayne remain a real concern. Back in 2000, the Fort Wayne MSA annual average wage was 102 percent of the state average wage and 90 percent of the national average wage.5 In 2010, the MSA’s average wage was $37,998, falling to 97 percent of the statewide wage and 81 percent of the U.S. average wage. We saw no appreciable improvement between 2009 and 2010 in this relative comparison. To have kept pace with inflation since 2000, the Fort Wayne area average wage would have needed to increase to $40,058 by 2010 but was actually $2,060 below that amount. Nationally, the average wage needed in 2010 to keep pace with inflation since 2000 was $44,739. The actual U.S. average wage outpaced inflation by $2,000 over
that period.
We have made real strides in recovery in the Fort Wayne area, and yet we have a significant way to go just to get back to pre-recession employment levels. We have even farther to go in recapturing the quality of our jobs. What should we expect from 2012? There are many critical unknowns at this point. Will the European debt crisis stabilize? Will the United States get its federal budget, deficit and debt issues under control, or will uncertainty continue to stymie business investment and consumer confidence. Both are important issues locally as the backbone of the Fort Wayne area economy continues to rest heavily on consumer purchase of durable goods.
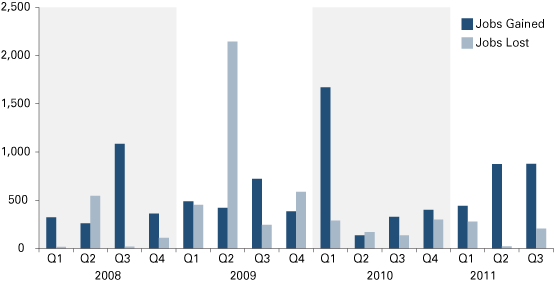
The number of jobs reflected in positive announcements (recalls, new hires, expansions and attractions) has outweighed the number of jobs associated with negative announcements (layoffs, downsizings and closings) as tracked by the Community Research Institute6 over the past five full quarters in the Fort Wayne region (see Figure 2). This should bode well for continued employment improvements in 2012. However, we are now experiencing the actual layoffs and transfers from Navistar, which will continue into the next year. They are estimated to have a direct impact of between 1,100 and 1,400 lost jobs. It is difficult to imagine that the area will continue the employment growth pace experienced during the past year. Seeing the unemployment rate drop in 2012 to the 7.5 percent range for the Fort Wayne area and the addition of 2,000 to 2,500 net new jobs would represent continued steady recovery. That forecast assumes a relatively stable national/international political scenario and an improving national economy.
Figure 2: Fort Wayne Metropolitan Area Number of Jobs Gained and Lost from Public Announcements, 2008 to 2011

Note: 2011 data are preliminary. Data, which are current as of November 3, 2011, are continuously being revised.
Source: Community Research Institute
Notes
- The Fort Wayne Metropolitan Statistical Area includes Allen, Wells and Whitley counties.
- Bureau of Labor Statistics Current Employment Statistics, non-seasonally adjusted total non-farm establishment employment.
- Local Area Unemployment Statistics non-seasonally adjusted data series.
- Bureau of Labor Statistics Current Employment Statistics.
- Bureau of Labor Statistics Quarterly Census of Employment and Wages.
- The Community Research Institute tracked company events related to jobs and investment in core industry sectors for each of the 10 counties of northeast Indiana on behalf of the Northeast Indiana Regional Partnership.
Also in this Issue…
- Outlook for 2012
- International Outlook for 2012
- U.S. Outlook for 2012
- Financial Outlook for 2012
- Housing Market Outlook for 2012
- Indiana's Outlook for 2012
- Indiana's Agricultural Outlook for 2012
- Anderson Forecast 2012
- Bloomington Forecast 2012
- Columbus Forecast 2012
- Evansville Forecast 2012
- Fort Wayne Forecast 2012
- Gary Forecast 2012
- Indianapolis-Carmel Forecast 2012
- Kokomo Forecast 2012
- Lafayette Forecast 2012
- Louisville Forecast 2012
- Muncie Forecast 2012
- Richmond Forecast 2012
- South Bend and Elkhart Area Forecast 2012
- Terre Haute Forecast 2012


