Bloomington Forecast 2011
Director of Economic Analysis, Indiana Business Research Center, Kelley School of Business, Indiana University
Research Assistant, Indiana Business Research Center, Kelley School of Business, Indiana University
During the Great Recession, the Bloomington Metropolitan Statistical Area (MSA) suffered considerably less than just about every other city or region in Indiana. In 2009 and 2010, Bloomington’s peers would be justified in being a tad jealous. In the coming year, the prospects for the Bloomington area are almost optimistic compared to most of Indiana and the Midwest.
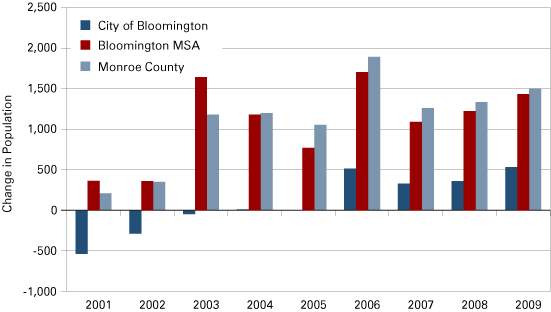
The Bloomington area has continued its steady, if moderate, population growth. This growth has helped to ease the recessionary pain of local businesses. As Figure 1 shows, population growth has been fairly even across all three geographic “definitions” for Bloomington—the city of Bloomington, Monroe County and the entire Bloomington MSA. The population of the Bloomington MSA has been on the rise thanks to the growth of Monroe County even while Greene County has lost population and Owen County has gained only a nominal number of residents in the last few years. In contrast to the first half of the decade when the city lost population while the rest of the county gained population, both the city of Bloomington and Monroe County have unambiguously grown in the last four years. In the coming years, the population is expected to continue its gradual increase.
Figure 1: Annual Population Change in Bloomington MSA, Monroe County and the City of Bloomington, 2001 to 2009
Source: IBRC, using U.S. Census Bureau data
The economic growth of the Bloomington MSA slowed, but not as rapidly as most other areas. Real GDP rose by 2.2 percent in 2008, the first year of the recession. Estimates show Bloomington’s GDP dropping by about the same percentage in 2009. Moody’s Analytics forecasts the rate of economic growth for both 2010 and 2011 to be about 2.5 percent.
Within the Bloomington MSA, different industries have experienced different patterns of growth. A vast majority of the goods-producing sector declined 1.0 percent from 2007 to 2008 while the service-producing sector grew at 1.9 percent (see Figure 2). Estimates show a more sizable drop in manufacturing GDP (-3.9 percent) than in service GDP (-2.4 percent) in 2009. Both sectors have turned around in 2010, however, with the service-producing sector returning to its 2008 level. Manufacturing, on the other hand, is not expected to surpass its 2007 level until 2011.
Figure 2: Bloomington MSA Gross Domestic Product by Aggregated Sectors, 2000 to 2012
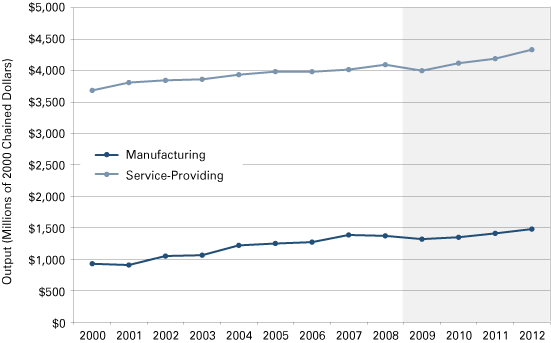
Note: Data for 2009 to 2012 are forecasts.
Source: IBRC, using Bureau of Economic Analysis data and Moody’s Analytics for forecast values
While Bloomington will likely register economic growth in GDP for 2010, the forecast for employment is not as positive because job growth typically lags economic growth. Payroll employment rose a fraction in 2008, 0.2 percent, and in 2009 that insignificant gain was reversed with a drop of 0.3 percent (see Figure 3). In light of the last two years, the forecasted increase of 1.9 percent for 2010 and 1.2 percent for 2011 may seem like good news, but it will not be enough to make a significant dent in unemployment.
Figure 3: Monroe County Total Employment, 2000 to 2012
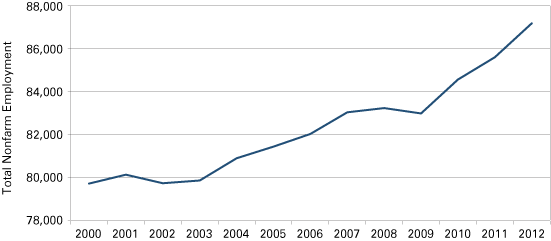
Note: Data for 2010 to 2012 are forecasts.
Source: IBRC, using Bureau of Economic Analysis data and Moody’s Analytics for forecast values
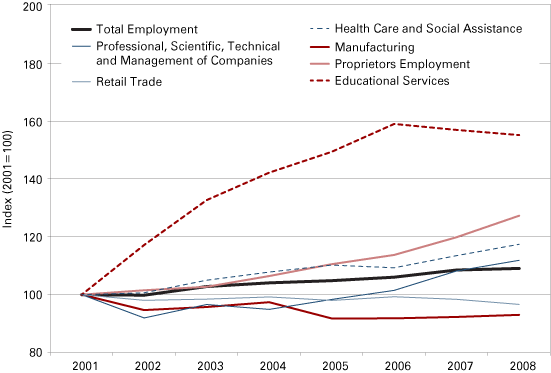
Figure 4 shows how the employment base has changed over the last few years. Manufacturing and retail trade lost jobs early in the decade, but have held steady more recently. The three industries that have maintained and even boosted Monroe County’s total employment are: 1) educational services, 2) health care and social assistance and 3) professional, scientific, technical services and management of companies. Proprietor employment also grew at a faster clip than total employment.
Figure 4: Industries in Monroe County with Notable Employment Gains and Losses, 2001 to 2008
Source: IBRC, using Bureau of Economic Analysis data
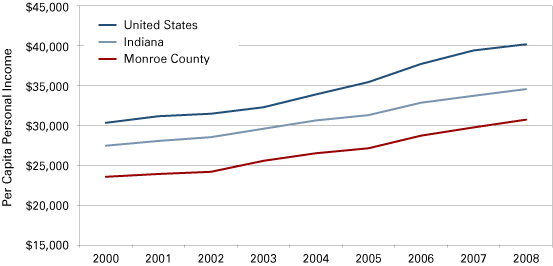
Personal income for the average Monroe County resident has been growing faster than the average Hoosier, but this is nothing to cheer. As Figure 5 shows, the level of per capita personal income for both the state and Monroe County fall below the national average. Even adjusted for the lower cost of living in Indiana—about 93 percent of the national average—Indiana and Monroe County lag behind.
Figure 5: Per Capita Personal Income, 2000 to 2008
Source: IBRC, using Bureau of Economic Analysis data
More distressing is that both the state and the county are losing ground relative to the nation. From 2000 to 2008, the average annual rate of growth for current-dollar PCPI in Indiana was a disappointing 2.9 percent, whereas the national average rate of growth was 3.5 percent. Monroe County’s annual average rate of PCPI growth was 3.3 percent for the same period.
The housing market in Monroe County has weathered the real estate storm reasonably well. Compared to last year at this time, year-to-date median home prices are up 5.6 percent, but sales are down by 5.2 percent. Year-to-date home sales statewide registered an uptick of 2.6 percent from last year, but both Monroe County and the state saw summer home sales drop significantly compared to last year, a consequence of the homebuyer’s tax credit expiring in May 2010.
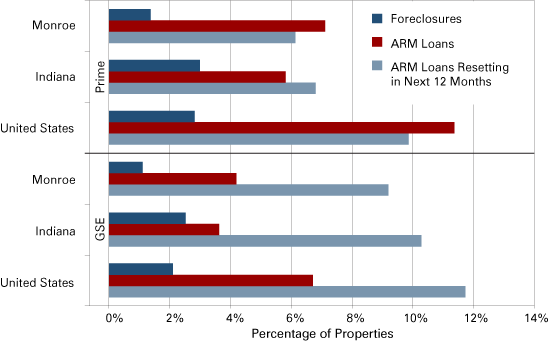
Based on foreclosure data released in the summer, the distress level of the Monroe County housing market appears to be relatively well contained and the county will not likely suffer the stresses of other regions across the state or the country. As Figure 6 shows, Monroe County has a lower percentage of properties in foreclosure than the state or the nation for both prime loans and the broader measure of loans guaranteed by the government-sponsored enterprises (GSE)—Fannie Mae and Freddie Mac—that serve as clearinghouses for most mortgages.
Figure 6: Housing Distress Measures for Monroe County, Indiana and the United States, July 2010
Source: IBRC, using New York Federal Reserve Lender Processing Services Mortgage Performance data
Also in this Issue…
- Outlook for 2011
- International Outlook for 2011
- U.S. Outlook for 2011
- Financial Outlook for 2011
- Housing Market Outlook for 2011
- Indiana's Outlook for 2011
- Indiana's Agricultural Outlook for 2011
- Anderson Forecast 2011
- Bloomington Forecast 2011
- Columbus Forecast 2011
- Evansville Forecast 2011
- Fort Wayne Forecast 2011
- Gary Forecast 2011
- Indianapolis-Carmel Forecast 2011
- Kokomo Forecast 2011
- Lafayette Forecast 2011
- Louisville Forecast 2011
- Muncie Forecast 2011
- Richmond Forecast 2011
- South Bend and Elkhart Area Forecast 2011
- Terre Haute Forecast 2011


