Education’s Value: It’s Not That Simple!
Independent Workforce Analyst
A growing body of thought claims that college may not be worth the cost. CNBC, Slate and NY Times have all had articles arguing that in a recession it makes no sense to prepare for jobs that aren’t there now and may never come back. Others say that, recession or not, college just costs too much. Still others say vision and motivation are what matter, as the success of Bill Gates and other college dropouts attests. A writer for Forbes has suggested, in one of the more novel arguments, that parents who can afford to send their child to an elite private college might be wiser to invest the money and endow their child with the dividend stream.1
Here in Indiana, though, we are dedicated to improving our educational attainment. We rank low in college attainment, and we know that an uneducated population makes a low-skilled workforce unfit for the new industries we want to promote. The commitment is firm and the argument is simple: A person with a bachelor’s degree will earn $15,000 or more per year over what someone with only a high school diploma earns. The number varies, but this message can be found in dozens of articles, reports, official pronouncements, and web posts.
But that message is too simple. Saying, “College graduates earn more” implies that college makes a sure difference all by itself—that it guarantees the $15,000 wage bonus. It doesn’t. Age, occupation, and other factors also shape the wage scale. Those other factors can diminish the advantage conferred by education. They can also magnify it. The link between college and higher earnings is more tentative than people think, but potentially more lucrative too.
We’ve been lulled by the appeal of the phrase, “The more you learn, the more you earn.” Perhaps it seems persuasive because it is lyrical. But as I’ll show, other catchy slogans are equally true.
If You Work The Year ‘Round, Your Earnings Will Compound
The ordinary standard of full-time employment and a forty-hour workweek isn’t prevalent, and high school graduates and college graduates don’t work the same amount. Some people work only thirty hours, while others work sixty or more. Most people stay on the job year-round, but others work only in the warm months, only during the school year, or only during the Christmas shopping season.
Census Bureau data for Indiana show that 59.1 percent of bachelor’s degree graduates worked full-time, compared to 40.7 percent of high school graduates.2 The average income for college graduates is higher because they work more. They would earn more even if both groups were paid the same rates for all jobs.
According to the Census Bureau’s Public-Use Microdata Sample (PUMS), when combining full-time Hoosier workers with a high school diploma or a bachelor’s degree, average annual wages are $43,184.3 When looking at them separately, the difference between high school and a bachelor’s degree is immediately evident. Average wages for full-time workers who are high school graduates are $36,441 compared to only $28,021 for all Indiana high school graduates.4 Bachelor’s degree graduates who work full-time and year-round make $56,156 compared to $44,248 for all bachelor’s. Clearly, the degree alone doesn’t make all the difference, and not all college graduates attain the promised benefit.
Despite Its Popularity, the Average Cloaks Disparity
The U.S. Census Bureau issued a seminal report in 2002 called The Big Payoff: Educational Attainment and Synthetic Estimates of Work-Life Earnings.5 That rigorous study adjusted for work time and other factors. It produced valid results. But it also encouraged less-wonkish folks to view complex results through the simplistic lens of the average. The report illustrated its findings with bar charts showing average annual earnings for each level of education. Bar charts have become the normal way to display the relationship between educational attainment and wages, and they wrongly imply that an increment of educational attainment causes a discrete step in earnings. It’s not that simple.
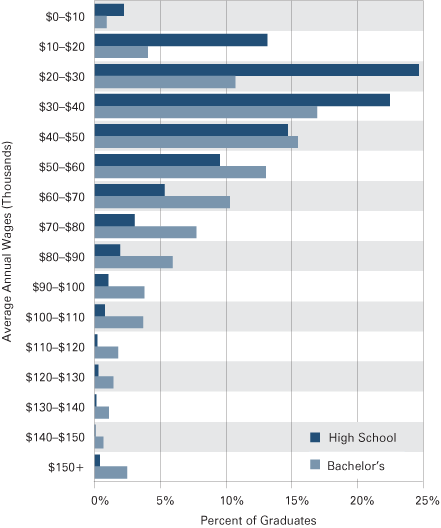
Figure 1 shows the distribution of annual wages for the PUMS sample. The two groups are not separated by a wide gap as the aggregate average implies. Rather each spreads across a wide distribution that overlaps the other distribution. There are both high school graduates and bachelor’s graduates at every level. The bachelor’s degree holders include some who have gained far more than the reputed $15,000 a year, and others who seemingly have gained nothing.
Figure 1: Wages by Percent of Graduates, 2006 to 2008

Source: IBRC, using the U.S. Census Bureau's Public-Use Microdata Sample
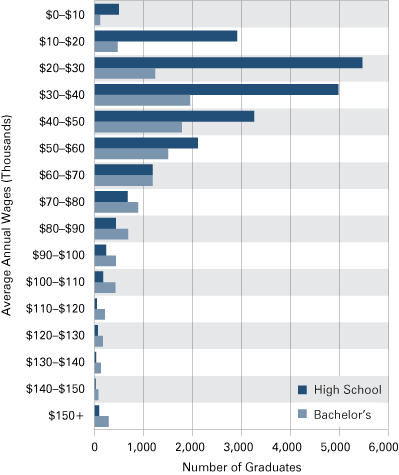
Figure 2 displays the wage curves for the same two groups in raw numbers rather than percentages, revealing another key point about the wage scale: High school graduates outnumber bachelor’s degree workers at every wage level below $70,000. Bachelor’s degree holders hold more of the jobs at all levels over $70,000, but both groups are represented in wage ranges far above the average.
Figure 2: Wages by Number of Graduates, 2006 to 2008

Source: IBRC, using the U.S. Census Bureau's Public-Use Microdata Sample
The Greater Your Age, the Higher Your Wage
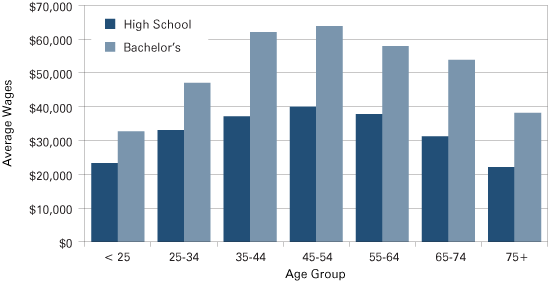
We have established that wages earned by Hoosier workers range broadly rather than clustering around educational attainment indicators. Now let’s consider how age affects wages. Figure 3 shows that bachelor’s earn more in each age group. Once again, we find that the oft-repeated $15,000 value understates the value of college.
Figure 3 raises puzzling questions about the age effect on wages. Why does the benefit of better education, which is $24,903 among 35–44 year olds, diminish to $20,058 for workers 55–64 years old? Why does the earnings curve decline after age 54 for both groups, even in this sample of full-time, year-round workers?
Figure 3: Wages by Age Group, 2006 to 2008

Source: IBRC, using the U.S. Census Bureau's Public-Use Microdata Sample
Choosing The Right Vocation Will Lead to Wealth Formation
Next we consider another important factor: occupational group. Table 1 displays average annual wages for each of twenty-two major occupational groups for high school graduates and bachelor’s degree holders.
Table 1: Average Annual Wages by Occupational Group, 2006 to 2008
| Occupational Group | High School Diploma | Bachelor's Degree | Numeric Difference | Percent Difference |
|---|---|---|---|---|
| Architecture and Engineering | $48,685 | $71,374 | $22,689 | 46.6% |
| Management | 42,739 | 70,792 | 28,054 | 65.6 |
| Computer and Math | 48,815 | 65,690 | 16,875 | 34.6 |
| Health Professions | 36,078 | 60,528 | 24,450 | 67.8 |
| Sales Occupations | 35,301 | 60,313 | 25,013 | 70.9 |
| Business and Financial Specialties | 41,852 | 59,063 | 17,211 | 41.1 |
| Life, Physical, and Social Sciences | 42,417 | 55,459 | 13,042 | 30.7 |
| Installation, Maintenance, and Repair | 45,842 | 53,986 | 8,144 | 17.8 |
| Production Occupations | 39,006 | 53,587 | 14,581 | 37.4 |
| Protective Services | 38,403 | 50,169 | 11,766 | 30.6 |
| Transportation and Material Moving | 38,474 | 49,844 | 11,370 | 29.6 |
| Construction | 40,906 | 48,946 | 8,040 | 19.7 |
| Art, Design, Entertainment, Sports, and Media | 32,759 | 43,753 | 10,994 | 33.6 |
| Office and Administrative Support | 32,036 | 42,191 | 10,155 | 31.7 |
| Farm, Forestry, and Fishing | 29,674 | 41,621 | 11,948 | 40.3 |
| Legal Occupations | 42,842 | 40,832 | -2,010 | -4.7 |
| Education | 24,721 | 36,934 | 12,213 | 49.4 |
| Social Services | 30,754 | 35,471 | 4,717 | 15.3 |
| Groundskeeping and Building Maintenance | 27,080 | 35,380 | 8,301 | 30.7 |
| Health Care Support | 24,556 | 29,513 | 4,957 | 20.2 |
| Food Preparation and Serving | 20,763 | 28,054 | 7,290 | 35.1 |
| Personal Services | 16,554 | 27,385 | 10,832 | 65.4 |
Source: IBRC, using the U.S. Census Bureau's Public-Use Microdata Sample
The value of education is apparent, but it is not consistent across skill groups. Education makes a relative, not a definite or absolute, difference. Bachelor’s degree holders in the personal services earn only $27,385, those working in food services make just $28,054, and those in health support occupations earn just $29,513. These are not just below the average for bachelor’s degree holders, but below the average for all working high school graduates. Meanwhile bachelor’s degree holders in engineering earn an average of $71,374, and managers earn $70,792. The education attainment bonus in these and other fields is far larger than the oft-quoted average. The key to a high income is not just a college degree, but the right sort of degree leading to work in a well-paying field. This important detail must be included in the message.
A look further down Table 1 displays a surprising finding. In this sample, high school graduates in the legal occupations earn more than those with a bachelor’s degree. The legal professions offer some of the best pay rates in the labor market to people with a juris doctor degree, but a bachelor’s degree has little value there.
Detailed examinations of occupations at which both high school graduates and bachelor’s work in large numbers provide further evidence of the complexity of the learn-earn relationship. A bachelor’s degree confers only a 10.3 percent wage advantage to secretaries.6 But clerical supervisors with a bachelor’s degree earn 51.8 percent, or $20,021 a year, more than similar workers with only a high school diploma.
Conclusion
Educational attainment is a major contributor to higher earnings and to more productive workers and more profitable companies. But the wage value of a college degree varies widely. The benefit is greatest for people who choose the right industry and occupation, and work full-time. Moreover, the value of college is not realized immediately but develops over a lifetime of work. When all relevant factors are considered, the result can be small or very large indeed.
Indiana should continue urging its students to finish high school and then proceed to some level of post-secondary educational attainment. But the message needs to be refined. Today, not enough Hoosier students are studying the fields that lead to the highest wage benefits—which, incidentally, are also the occupations that our key industries most depend on. Meanwhile, too many Hoosier students are engaged in studies that will lead to a degree but not to the promised income.
The goal is not to undermine but to strengthen Indiana’s commitment to greater educational attainment. The state’s researchers, school counselors, and other workforce and education leaders need to step beyond the undue reliance on aggregate averages and one glib catchphrase. We must develop a message that accords with the complex reality of the labor market.
Notes
- Rich Karlgaard, “Is College Worth It?” Forbes.com, March 27, 2006, www.forbes.com/forbes/2006/0327/039.html.
- Data are extracted from the 2006–2008 American Community Survey three-year Public-Use Microdata Sample (PUMS) file. Full-time is defined here as working forty-eight or more weeks during the year and thirty-five or more hours per week. This subset provides 33,654 records.
- American Community Survey, 2006–2008, Table B20004: http://factfinder.census.gov/faces/tableservices/jsf/pages/productview.xhtml?src=bkmk.
- Jennifer Cheeseman Day and Eric C. Newburger, “The Big Payoff: Educational Attainment and Synthetic Estimates of Work-Life Earnings,” U.S. Census Bureau Special Studies, July 2002, www.census.gov/content/dam/Census/library/publications/2002/demo/p23-210.pdf.
- This is based on a PUMS sample of 715 high school graduates and 192 bachelor’s degree holders.
- This is based on a PUMS sample of 274 high school graduates and 184 bachelor’s degree holders.
Also in this Issue…


