Bloomington Forecast 2010
Director of Economic Analysis, Indiana Business Research Center, Kelley School of Business, Indiana University
November 2009
In 2009, Bloomington’s economy took a glancing blow. Compared to state and regional neighbors, Bloomington was an island of relative stability. As in 2009, the prospects for the Bloomington area for 2010 are brighter than for much of Indiana and the Midwestern region.
Population
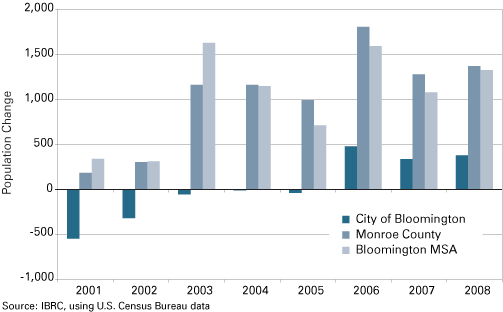
Population growth tends to stimulate local businesses and in the last few years, the Bloomington area has experienced moderate population growth. As Figure 1 shows, this growth has been predominantly in Monroe County. While the total population of the Bloomington Metropolitan Statistical Area (MSA) has been on the rise, Greene and Owen counties (the other two counties in the Bloomington MSA) have, taken together, lost population in the last five years. In the first half of the decade, the city of Bloomington’s population declined by almost a thousand people; but in the last three years, it has regained lost ground. In the coming years, the population is expected to continue its gradual increase.
Figure 1: Annual Population Change, 2001 to 2008
Gross Domestic Product
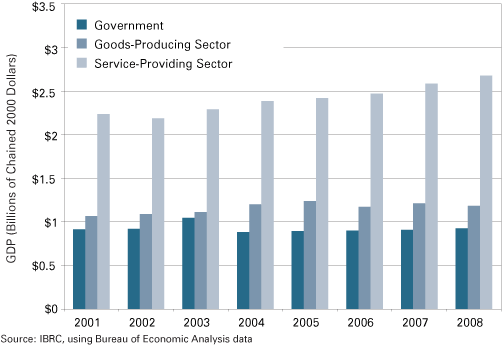
The economic growth of the Bloomington MSA slowed, but not as rapidly as other areas. In contrast to the state, which registered a real gross domestic product (GDP) decline of 0.6 percent from 2007 to 2008, Bloomington’s economy grew at a rate of 1.7 percent. This rate of growth roughly equals the annual average from 2001 to 2008. The growth was not spread evenly among industries, however. Manufacturing—a vast majority of the goods-producing sectors in Figure 2—declined 2.2 percent from 2007 to 2008 while the service-providing sector grew 3.6 percent. In terms of growth since 2001, the stand-out industry is professional and business services—which grew at an average annual rate of 6.4 percent over the period and 8.7 percent in 2008.
Figure 2: Gross Domestic Product by Aggregated Sectors, 2001 to 2008
Employment
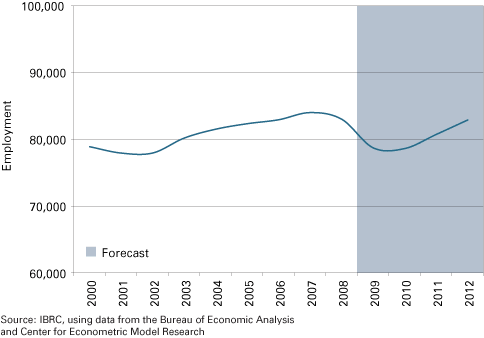
So while Bloomington will likely report a decline in GDP of about 2 percent for 2009 and rebound gradually in 2010, the forecast for employment is less optimistic. Employment growth typically lags economic growth. There will likely be employment losses at the beginning of the year and gains at the close of the year. The net for the year will likely register a flat or slightly negative job picture for 2010. Indeed, based on the forecast, employment in Monroe County won’t bottom out until 2010, as Figure 3 shows. After growing by an annual average rate of 1.2 percent from 2001 to 2007, the subsequent slowdown in the economy will put overall employment at about the same level as during the millennial recession. Because anemic economic growth is expected both nationally and regionally, the 2007 level of employment isn’t expected to return until after 2012.
Figure 3: Monroe County Total Employment, 2000 to 2012
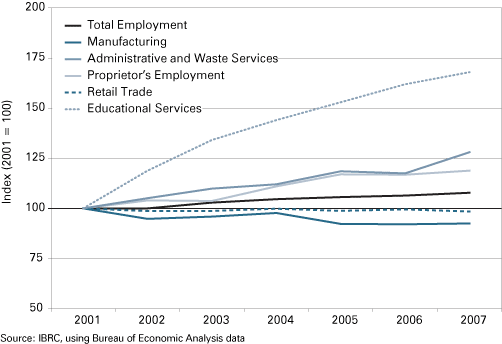
The structure of the economy in the Bloomington area has undergone a transformation over the last few years. As Figure 4 shows, manufacturing and retail trade have lost jobs since 2001. The two stand-out industries in terms of employment growth were administrative and waste services and educational services. Proprietor employment also grew at a faster clip than total employment.
Figure 4: Industries in Monroe County with Notable Employment Gains and Losses, 2001 to 2007
Per Capita Personal Income
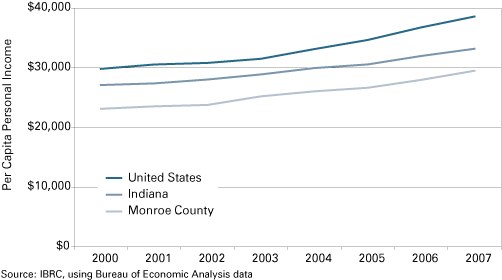
On the per capita personal income (PCPI) front, the data are nothing to boast about. As Figure 5 shows, the level of PCPI for both the state and Monroe County fall below the national average. Even more significant is the fact that the rate of current-dollar PCPI growth in Indiana from 2001 to 2007—2.9 percent—is materially below that of the nation as a whole—3.7 percent. At a rate of 3.5 percent, Monroe County betters the state average, but is still shy of the national average.
Figure 5: Per Capita Personal Income, 2000 to 2007
Housing
On a final, more positive point, the Monroe County housing market has remained reasonably stable. Compared to last year, home sales through September were down a mere 2.8 percent. That doesn’t sound great until one weighs it against the state average (a 13.5 percent decline). The state average fall in median home sale price, however, was just a tad greater than Monroe County, -3.2 percent and -2.6 percent, respectively. Table 1 presents current real estate data for Monroe County, the state and other selected counties. Even compared to the counties with a large university presence, and hence a cyclical economic cushion, Monroe County has been spared plummeting home prices.
Table 1: Monroe County Real Estate Market Compared to Other Selected Indiana Counties, 2008 to 2009
| County | Percent Change in Units Sold* | Percent Change in Median Sales Price* |
| Indiana | -13.5 | -3.2 |
| Monroe | -2.8 | -2.6 |
| Vanderburgh | -8.1 | 0.5 |
| Allen | -10.3 | 1.1 |
| Tippecanoe | -10.9 | -2.0 |
| Marion | -14.4 | -2.4 |
| St. Joseph | -22.1 | -1.2 |
| Bartholomew | -39.4 | -5.3 |
*From previous year
Note: 2009 data includes January through September only.
Source: IBRC, using Indiana Association of Realtors data
Also in this Issue…
- Outlook for 2010
- International Outlook for 2010
- U.S. Outlook for 2010
- Financial Outlook for 2010
- Housing Market Outlook for 2010
- Indiana's Outlook for 2010
- Indiana's Agricultural Outlook for 2010
- Anderson Forecast 2010
- Bloomington Forecast 2010
- Columbus Forecast 2010
- Evansville Forecast 2010
- Fort Wayne Forecast 2010
- Gary Forecast 2010
- Indianapolis-Carmel Forecast 2010
- Kokomo Forecast 2010
- Lafayette Forecast 2010
- Louisville Forecast 2010
- Muncie Forecast 2010
- Richmond Forecast 2010
- South Bend and Elkhart Area Forecast 2010
- Terre Haute Forecast 2010


