The Indiana Leading Economic Index: Indicators of a Changing Economy
Director of Economic Analysis, Indiana Business Research Center, Kelley School of Business, Indiana University
Research Assistant, Indiana Business Research Center, Kelley School of Business, Indiana University
Prediction is very difficult, the Danish physicist Niels Bohr said, especially regarding the future.
Even so, economists and market watchers are often asked what the economic future holds. Businesses want to plan purchases and hiring and make projections about revenues and earnings. Government officials want to know how well tax revenues will match expenditures on programs. Everyone wants to know about, and make adjustments for, dramatic economic downturns such as the current recession.
Economists and market analysts have developed indexes to help anticipate the future direction of the economy in the short-run. The index with the greatest notoriety is probably the Leading Economic Index produced by The Conference Board. The Leading Economic Index represents years of research and analysis but, as robust as it may be, the index is national in scope. It doesn’t necessarily reflect the regional dynamics and particular structure of the Indiana economy.
As a result, the Indiana Business Research Center recently developed an Indiana-specific index of leading economic indicators. This article briefly describes the Leading Index for Indiana (LII).
Developing the Index
The IBRC took four steps to develop a leading economic index for Indiana:
Create an index of current economic activity and, in contrast to national recessions and expansions, use it to identify Indiana economic activity.
Identify key sectors that tend to guide economic activity in Indiana.
Find measures of economic activity at either the national level or state-specific level that predict movements in those key Indiana sectors.
Combine these indicators to produce a leading index for economic activity in Indiana.
In order to predict recessions, we must be able to identify the beginning and the end of recessions. This is done using a coincident index. A coincident index measures current economic activity. Several other states have developed indexes of leading economic indicators—Iowa, Oregon, Nevada and Ohio—and used total nonfarm employment as their coincident index.
The National Bureau of Economic Research (NBER) defines recession, however, based on the significant decline in a collection of economic indicators. As a result, the IBRC sought a broader set of measures to create a coincident index. The Philadelphia Federal Reserve produces coincident indexes for individual states. Following their lead, the IBRC used nonfarm employment plus the average hours worked in manufacturing, the unemployment rate, and wages and salaries (adjusted for inflation).
The Philadelphia Fed also provides rules for identifying state recessions, based roughly on rules for identifying a recession at the national level. A recession is deemed to occur when the state coincident index falls, from peak to trough for at least three months and by at least 0.5 percent.
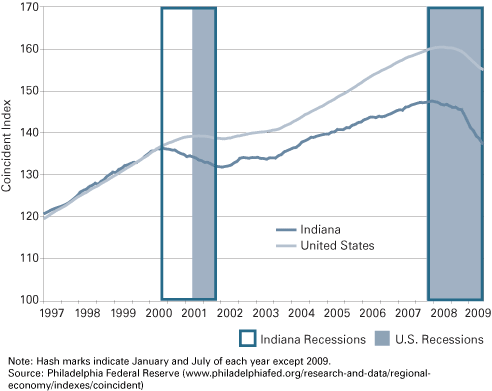
Individual state recessions typically occur in conjunction with national recessions, but the duration can be different. The peak before the millennial recession occurred in May 2000 in Indiana, with the trough in January 2002. Like the national recession, the current Indiana recession began in December 2007. Figure 1 graphically depicts the behavior of the Indiana and U.S. economies from 1997 through July 2009. The blue boxes show the Indiana recessions and the shaded areas show the U.S. recessions.
Figure 1: Coincident Indexes of the Indiana and U.S. Economies
Key Sectors in Indiana
Leading indicators must satisfy two basic criteria. They must be economically reasonable and empirically demonstrable. To develop specific leading indicators for Indiana, one can take one of two approaches. The first option is to use time series data at the state level that have been shown to lead economic activity in Indiana. Unfortunately, the scarcity of state-level data poses a significant challenge in terms of developing measures that are Indiana specific. Option two is to use national time series data concerning sectors in which Indiana has a particular interest.
Data on Indiana’s economic output suggest the following three supersectors significantly affect economic activity in the state. In 2007, manufacturing contributed 29 percent to private GDP. Transportation and trade contributed another 17 percent. The third supersector—finance, insurance and real estate—also contributed 17 percent to private GDP. An effective leading indicator should portend economic activity in these sectors.
Table 1 presents the five indicators that compose the LII. Because Indiana-specific data were not available for the length of time needed to analyze the relationship between the data and the Indiana coincident index, all series are national level data.
Table 1: Five Indicators that Make Up the LII and Their Associated Supersectors
| Indicator | Associated Supersector |
| Manufacturing Purchasing Mangers Index | Manufacturing |
| Unfilled orders for motor vehicles and parts | Manufacturing |
| Dow Jones Transportation Index | Transportation and trade |
| Housing Market Index | Finance, real estate and insurance (also predicts construction activity) |
| Interest rate spread | Finance, real estate and insurance (also predicts business investment) |
Source: Indiana Business Research Center
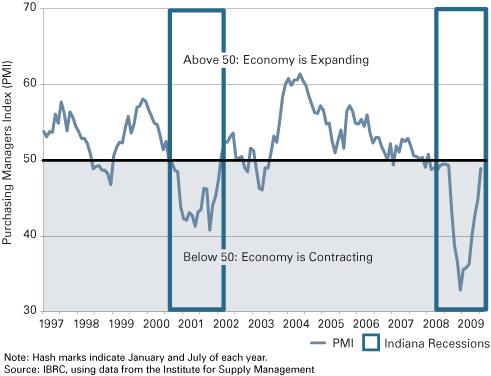
Given that manufacturing is such a predominate share of the Indiana economy, it should come as no surprise that both the Institute for Supply Management Purchasing Managers Index (PMI) for manufacturing and the U.S. Census Bureau data on motor vehicles and parts (unfilled orders) would be included in the LII. The PMI is commonly used as a national leading indicator (see Figure 2). Based on a national survey of supply and purchasing managers, the PMI measures month-to-month changes in business sentiment. The PMI measures changes, positive or negative, in expectations for business in the present and coming months.
Figure 2: Purchasing Managers Index for Manufacturing in the United States
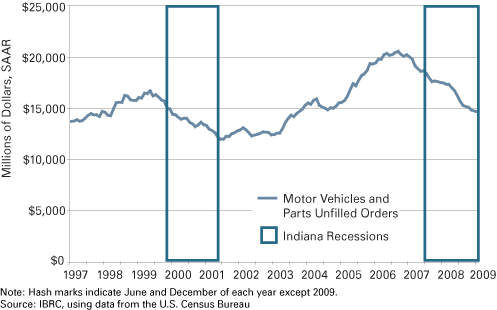
Unfilled orders of motor vehicles and parts monthly data is published by the U.S. Census Bureau. The rationale for including this measure is that unfilled orders tend to decline before recessions. Given that Indiana’s economy is so heavily automobile dependent, big drops in unfilled orders for motor vehicles and parts lead to big drops in automotive manufacturing activity. Declines in this data series have led the past two recessions by six months and ten months, respectively. Figure 3 shows how the decline in unfilled orders of motor vehicles and parts predates downturns in Indiana (boxes outlined in blue). The graph also shows the desired behavior of the indicators that compose a leading index.
Figure 3: Unfilled Orders for Vehicles and Parts in the United States
The Dow Jones Transportation Index tracks twenty transportation and logistics companies. Indiana, as the crossroads of America, has a relatively large transportation and logistics sector. Since stock prices tend to be forward looking, it stands to reason that it would be a component in Indiana’s leading index.
The Housing Market Index (HMI) is published monthly and uses surveys of home builders to gauge the level of confidence in the real estate and construction industry. Since 1990, the HMI has led Indiana construction employment movements by roughly six months.
The interest rate spread measures the extent to which investors anticipate a recession in the near future. The spread, the yield on ten-year Treasury bonds minus the Federal Funds Rate, has become negative before all recessions since 1970.
Putting the Index Together
There are a few more steps before the five data series become an index. Several measures are noisy and, as a result, the series is smoothed by using moving averages. Then, monthly changes are calculated for each indicator. These changes are statistically standardized to ensure that each indicator receives equal weighting. At this point, the indicators are combined by summing the standardized monthly changes. Finally, a base year is selected and the index is calibrated to that year. The LII is based in 1997, the first year for which data for all five data series are available.
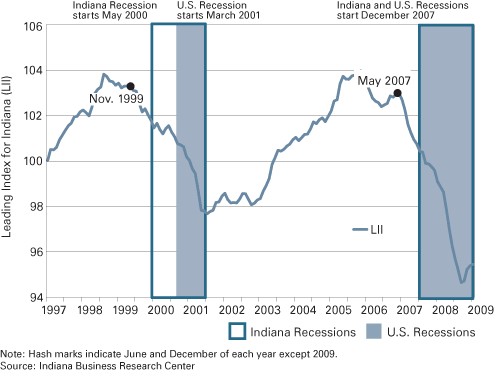
As Figure 4 shows, the leading index began a steady decline well before both of the recessions since 1997.
Figure 4: The Leading Index for Indiana since 1997
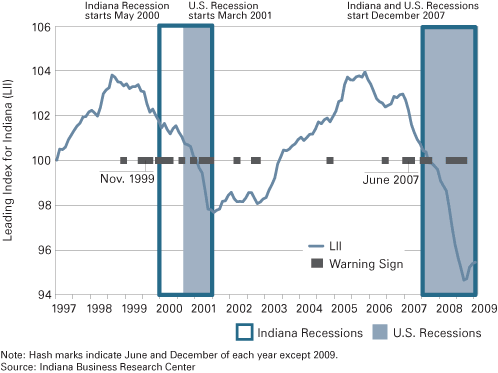
Warning signs of an impending recession—when at least three out of the five indicators turn negative—occurred six months before both the 2000 and current recessions.1 These warning signs can provide state government officials an indicator of the coming economic storm and that additional burdens are likely for economic relief programs (e.g., unemployment insurance) and social welfare programs (e.g., food stamps and Medicaid). Figure 5 shows that the LII gave definitive signals—several months of warning signs—of an impending recession in November 1999 and June 2007.
Figure 5: The LII and Warning Signs of Impending Recessions
How Well Does It Work?
The index generated warnings in the right places, but it also generated a few false alarms (warning signs that do not precede a recession). False alarms are a concern, but one way to identify false alarms is to supplement the index with other indicators of economic activity. For example, one could link the Leading Index for Indiana with other economic dashboard indicators for gauging Indiana’s economic activity. Such a dashboard may include: The Conference Board’s Leading Economic Index; The Architectural Billings Index; Indiana initial unemployment insurance claims; help-wanted ads in Indiana newspapers; an Indiana stock index and Indiana manufacturing hours worked.
Another more expensive, but potentially more useful gauge for the dynamics of the Indiana economy would be an Indiana specific PMI-like indicator. An “Indiana PMI” would require surveying Indiana businesses and collecting and analyzing the movements in the expectations of Indiana managers. The work on the LII was made possible by funding by the Indiana Department of Workforce Development. The IBRC is hopeful that there will be additional opportunities to explore better ways to monitor and report the state of the Hoosier economy in the coming months and year.
Find the LII online at www.stats.indiana.edu/lii.
Notes
- It is important to recognize, however, that the data comprising the complete leading index are released with a six-week lag. A preliminary index that uses four of the five components is available a week after the end of the month.
Sidebar: Economic Green Shoots
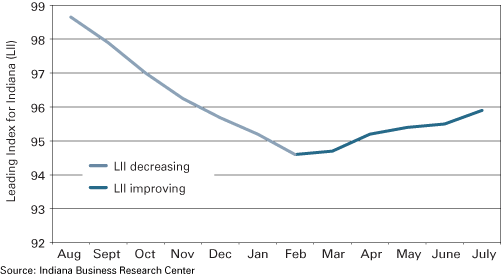
The Leading Index for Indiana, August 2008 to July 2009
