
Indiana's Outlook for 2009
Director, Indiana Business Research Center, Kelley School of Business, Indiana University
November 2008, updated December 2008
Indiana is not immune to the forces shaping the national and global economies, so its outlook for the year ahead is similarly cloudy. At the same time, certain aspects of Indiana's economy cause the Hoosier State to perform in idiosyncratic ways. This article briefly overviews several dimensions of our state's recent performance and its outlook for 2009.
Overall Economic Output
The broadest measure of our economic activity is gross domestic product (GDP) at the state level. Indiana's GDP grew very slightly (0.3 percent) in 2007 following two years of small declines. Although these three relatively flat years followed several years of 2 percent to 4 percent annual increases, the rest of the nation has seen stronger GDP growth; since 2000, only Ohio and Michigan have had slower GDP growth than Indiana.
Indiana's manufacturing output has decreased over the past three years, but manufacturing's share (28 percent) of Indiana GDP is still the largest of any sector; only one state (Oregon) is more reliant on manufacturing. Indiana sectors with GDP that has grown in recent years include retail; transportation and warehousing; arts and entertainment; health care; technical services; and administrative and support services.
The outlook for 2009 calls for limited growth in GDP, given the weak national and global economies on which so many Indiana firms depend, coupled with weakness in the consumer sector and the automotive industry. There is some potential for further downward momentum (depending in part on the speed and effectiveness of federal stimulus actions), although late in the year we may see some GDP growth return.
Exports
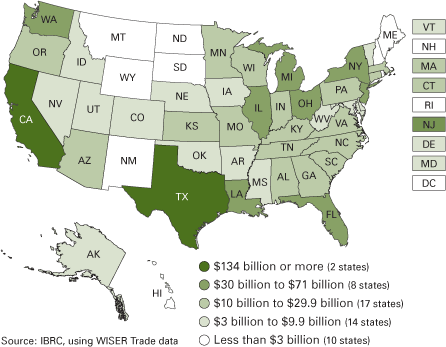
Indiana exports reached a record $26 billion in 2007, up 14 percent from the previous year. Led by vehicles and parts, industrial machinery, electronics, and pharmaceuticals, this performance moved us up to twelfth place among the states (see Figure 1). Key factors in this growth have been booming economies overseas and a weak dollar. The dollar's recent strength, however, coupled with slower economic growth abroad presages slower export growth in 2009. This should contribute to weak GDP growth for Indiana.
Figure 1: Value of Exports by State in Current Dollars, 2007
Employment and Unemployment
In all but one month from December 2003 through April 2008, Indiana's payroll employment showed year-over-year gains. Starting May 2008, however, we've had five months in a row of job losses compared to a year earlier (see Figure 2), the first such streak since employment bottomed out in summer 2003. By that nadir, the state's payrolls had lost more than 130,000 jobs over a two-year period; fortunately, the current recession does not portend quite so bleak an outlook.
Figure 2: Indiana's Unemployment Rate and Change in Payroll Jobs, January 2003 to September 2008
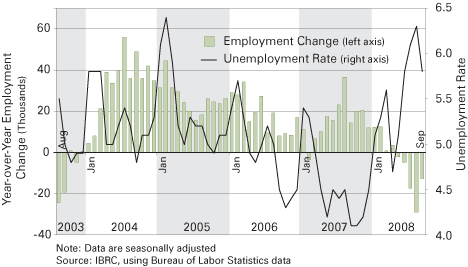
Sectors with notable shrinkage over the past year include manufacturing (-2.8 percent year-to-date) and construction (-2.1 percent). On the other hand, employment has grown in some of the larger sectors, including education and health services (+2.3 percent), government (+1.5 percent), and leisure and hospitality (+0.8 percent).
Indiana has maintained a strong pace in announcements of business attraction and expansion, which helps us perform better on employment measures than other Midwestern states. However, some of these firms may slow their growth plans until the overall economy shows more strength and credit loosens up. There have been significant layoffs recently in the steel and automotive sectors, finance and real estate, and other industries sensitive to weak consumer or industrial demand and tight credit. Although Indiana's unemployment rate has been a bit higher than usual in recent months, it's still not far above its average over most of this decade.
The jobs outlook for 2009 calls for shrinkage by about 50,000 jobs, and then turning back up near the end of the year. Average unemployment for the year should be in the 6.5 percent to 7.5 percent range.
Personal Income
Hoosiers' total personal income (PI) reached a record high of $219 billion in the second quarter of 2008. As shown in Figure 3, Indiana's PI has grown more slowly than the nation. Indiana's PI has grown by only 32.7 percent since 2000, while U.S. PI has increased 45.2 percent. Slow population growth in Indiana accounts for part of this growing gap (as do structural shifts in the state's economy), so it's useful to look at per capita personal income (PCPI) to control for population growth.
Figure 3: Growth in Quarterly Personal Income, Indiana vs. United States, 2000 to 2008
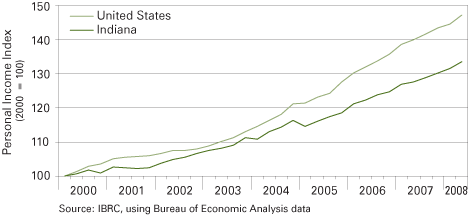
Indiana's PCPI last year trailed the national figure by a record $5,412. Put another way, the state's PCPI fell to 86 percent of the national value, a drop of 5 percentage points in just four years. A longer-term view reveals that PCPI has been generally declining relative to the nation for the past half century. Although many factors contribute to this trend, an important one is Indiana's reliance on manufacturing. When factories were shuttered during the Great Depression, our PCPI fell to 77 percent of the nation's, rebounding to surpass the national PCPI during World War II and the early post-war years when factories were humming. In the coming year, we do not anticipate much rebound for Indiana's PCPI.
Housing
Since Indiana did not experience a big housing bubble, it has not suffered nearly as much as other parts of the country when the bubble burst. Nonetheless, single-family building permit activity so far this year is 25 percent to 30 percent below 2007 and about half its peak rate in 2005. Fortunately, we anticipate some revival of home building (perhaps as much as a 25 percent gain) in 2009, when much of the housing surplus will have been absorbed.
Sales of existing homes should end 2008 down 10 percent to 15 percent from 2007 and rise slightly in 2009. Multi-family housing construction will remain rather slow.
Conclusion
In summary, Indiana's outlook for 2009 is one of continued economic challenge echoing the national situation, though there is some light at the end of the tunnel toward the end of the year and a few bright spots along the way.
Also in this Issue…
- Outlook for 2009
- International Outlook for 2009
- U.S. Outlook for 2009
- Financial Outlook for 2009
- Housing Market Outlook for 2009
- Indiana's Outlook for 2009
- Indiana's Agricultural Outlook for 2009
- Indiana's Special Sectors Outlook for 2009
- Anderson Forecast 2009
- Bloomington Forecast 2009
- Columbus Forecast 2009
- Evansville Forecast 2009
- Fort Wayne Forecast 2009
- Gary Forecast 2009
- Indianapolis-Carmel Forecast 2009
- Kokomo Forecast 2009
- Louisville Forecast 2009
- Muncie Forecast 2009
- Richmond Forecast 2009
- South Bend and Elkhart Area Forecast 2009
- Terre Haute Forecast 2009
- Return to Table of Contents
