Key Aspects of Per Capita Personal Income
Economic Research Analyst, Indiana Business Research Center, Kelley School of Business, Indiana University
Total personal income and per capita personal income (PCPI) are two of our most relied upon measures of economic standing. These indicators are a useful way to, among other things, gauge economic growth over time or compare counties and states to their counterparts. Indiana’s 2005 PCPI, for instance, stands at $31,150. This mark places Indiana thirty-fourth among all states and is only 90 percent of the U.S. PCPI of $34,495.
What does a figure like this actually mean though? What does it tell us about how Hoosiers earn their income or how much is actually available to them to be spent? The Bureau of Economic Analysis, which calculates these statistics, offers several ways to deconstruct personal income and view its component parts.
Components of Personal Income
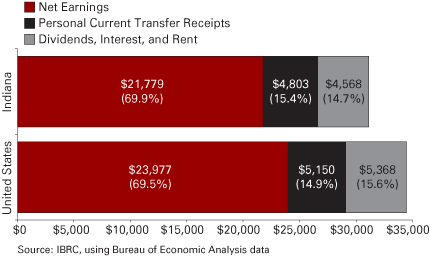
The BEA uses three components to determine personal income: employment earnings, transfer payments (government payments made to individuals), and investment income (dividends, interest, and rent). Figure 1 shows that the component shares of Indiana’s PCPI are nearly identical to those of the United States. In each case, earnings account for around 69 percent of all personal income. The lone difference among the two is that transfer payments hold a slight edge over investment income in Indiana while the opposite is true for the nation.
Figure 1
Component Shares of PCPI in Indiana and the United States, 2005
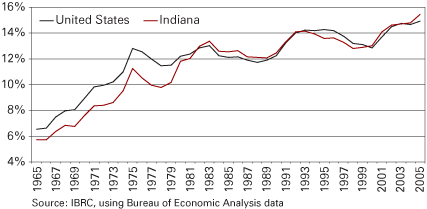
The key trend in terms of personal income composition has been the steady growth in transfer payments at the expense of earnings over the past forty years.
Indiana’s share of transfer payments has grown from 5.7 percent of all personal income in 1965 to 15.4 percent in 2005 (see Figure 2). At the same time, Hoosier earnings as a share of the total decreased from 82.5 percent to 69.9 percent. Indiana’s investment income as a percent of personal income reached as high as 19 percent several times between 1984 and 1990 before settling in at its current 14.7 percent.
Figure 2
Transfer Payments as a Percent of Total Personal Income, 1965 to 2005
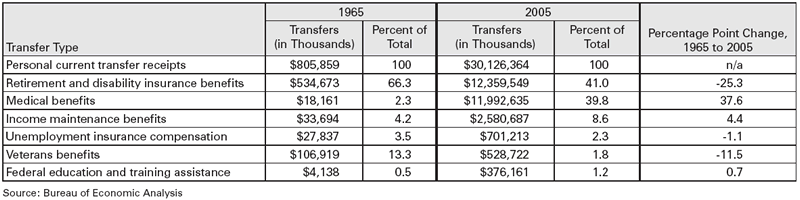
What is driving this shift? The quick answer is the combined effects of an aging population, increased life expectancy, and an expansion in public benefits. In this respect, 1965—the year that the Medicare and Medicaid programs were created—is a watershed date. These two programs accounted for nearly 40 percent of all transfer payments to Indiana residents in 2005 (see Table 1). Other benefit types that increased their share of transfer payments between 1965 and 2005 were income maintenance benefits (supplemental security income, family assistance, food stamps, etc.) and federal education and training assistance.
Table 1
Selected Transfer Payments in Indiana, 1965 and 2005
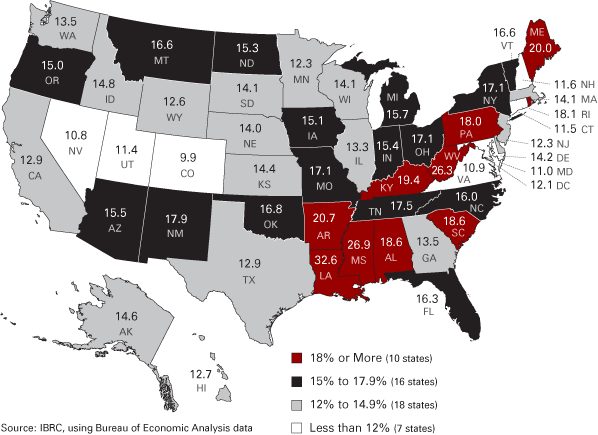
While Indiana’s transfer payment share closely resembles that of the overall United States, there is actually quite a bit of variability among the states. Figure 3 illustrates the percent of each state’s personal income that is attributed to transfer payments. The one figure that jumps off the map is in Louisiana. This figure is certainly attributed to assistance in the wake of Hurricane Katrina as it represents a 51 percent increase over 2004. Indiana ranks twenty-third in the nation in terms of transfer payments as a percent of personal income.
Figure 3
Transfer Payments as a Percent of Personal Income by State, 2005
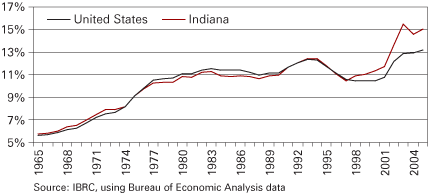
Disposable Income
Another key aspect of the personal income puzzle is disposable personal income (DPI). DPI is simply personal income after personal taxes are removed. In other words, DPI represents the amount of money that people have available to spend or save as they wish.
BEA’s measure of personal current taxes is based primarily on federal, state, and local income taxes. Other types of taxes in this indicator include personal property taxes (although not property taxes paid on homes, which is calculated as an expense and subtracted directly from BEA’s personal income calculation), state and local licensing of vehicles, hunting and fishing permits, and marriage licenses.
The notable omissions of sales and property taxes from BEA’s formulation make this an imperfect tool for making an “apples to apples” comparison of tax liability by state. For instance, six states do not collect their own income tax but may instead apply higher sales or property taxes.
The BEA estimates that Hoosiers paid $3,254 in personal taxes on a per capita basis in 2005. These taxes account for 10.4 percent of Indiana’s PCPI and result in a per capita disposable personal income (PCDPI) of $27,896, ranking thirty-fourth in the United States.
Figure 4 tracks Indiana’s personal taxes as a percent of its personal income compared to the United States. These follow a similar trend since, on average, federal income taxes have accounted for 82 percent of Indiana’s and the United States’ total personal tax since 1965. The share of Indiana’s personal income that is paid in personal taxes declined steadily from 1999 to 2004 when it reached its lowest point of 9.7 percent.
Figure 4
Personal Current Taxes as a Percent of Total Personal Income, 1965 to 2005
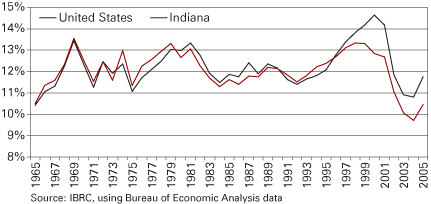
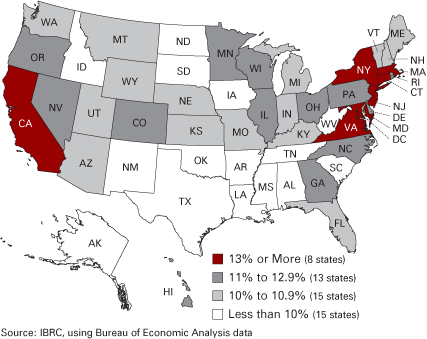
Figure 5 illustrates the level of personal taxes as a percent of personal income by state. Not surprisingly, the highest percentages are found in the Northeast and Mid-Atlantic states as well as California. Indiana recorded the twenty-second lowest percentage in 2005.
Figure 5
Personal Taxes as a Percent of Personal Income, 2005
What about Benefits?
An important segment of many Hoosier’s incomes are fringe benefits in the form of employer contributions to pensions, private insurance funds, and government social insurance. BEA combines these benefits with wages and salaries paid to employees to define a compensation of employees measure.
The components of Indiana’s 2005 total compensation break-down in the following manner: wages and salary account for 79 percent; employer contributions to pensions and private insurance funds represent 15 percent; and employer contributions to government social insurance adds 6 percent.
However, employer contributions to government social insurance are not a direct benefit to the actual employee, but rather part of the vehicle that is used to pay for transfer payments. Wages and salaries plus employer contributions to pensions and private insurance funds (benefits) contribute to the earnings component of personal income discussed earlier.
Indiana’s share of employer contributions to benefits as a percent of compensation has increased nearly threefold since 1965 (see Figure 6). Indiana’s growth since 2001 has been particularly sharp with an increase from 11.7 percent to 15 percent.