Mixed Messages in Compensation per Job
Indiana Business Research Center, Kelley School of Business, Indiana University
Indiana and the Nation
How is Indiana doing compared with the nation? As economists are wont to say: “It depends.” Over a four-year period of time, compensation per job in the state has grown just slightly faster than the United States, but for the most recent past year, we have trailed the nation.
In 2001, Indiana’s compensation per job (1) (wages, salaries, bonuses, employer contributions to pensions and benefits, as well as social security and Medicare) stood at $37,754 or 88.3 percent of the nation’s $42,742. Hoosiers lagged by $4,988. By 2005, we were up to 88.6 percent of the national level, but $5,680 behind the U.S. average (see Figure 1).
Figure 1
Compensation per Job, 2001 to 2005
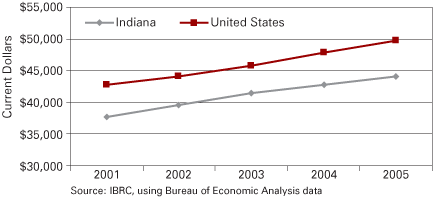
How can we be gaining and losing out at the same time? Our relative position is improving (our percent of the national level) but our absolute difference from the United States is deteriorating. The reason is that our rate of growth in compensation per job is only slightly higher than that of the nation. A somewhat slower rate of growth applied to a higher level yields more in gains than does the faster growth rate applied to a lower initial level. Hence the two lines in Figure 1 are further apart in 2005 than 2001, despite the fact that Indiana had a marginally higher rate of growth.
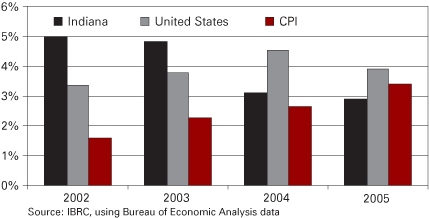
The growth rates over this period are of interest (see Figure 2). Indiana’s rates of growth have slowed between 2002 and 2005 while the nation saw an upward trend from 2002 to 2004. At the same time, the Consumer Price Index (CPI) has risen progressively, cutting into the real gains of all Americans. In 2005, the CPI rate of growth exceeded Indiana’s growth in compensation per job, thus leaving Hoosiers with a decrease in real compensation growth.
Figure 2
Rate of Growth in Compensation per Job, 2002 to 2005
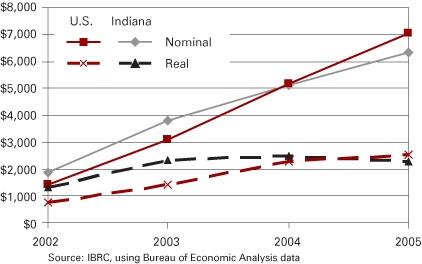
The differences in cumulative nominal and real growth of compensation per job are shown in Figure 3. Although Hoosier jobs seemed to pay a cumulative gain of $6,341, after adjusting for inflation this was merely $2,282 in dollars of constant buying power. Thus jobs in the United States and Indiana offered a real cumulative gain of just 36 percent of their nominal amount.
Figure 3
Cumulative Gains in Compensation per Job, 2002 to 2005
Between 2001 and 2005, Indiana’s total compensation per job grew faster than the nation (16.8 percent vs. 16.5 percent). Although the difference is small, some might brag about our “superior” growth rate. Why did our compensation per job grow faster than the nation? The answer lies in the mystery of numerators and denominators.
Total compensation in the United States grew by 18.2 percent while advancing by 16.9 percent in Indiana from 2001 to 2005. During the same years, the nation’s number of jobs grew by 1.5 percent while Indiana had an anemic 0.1 percent increase in jobs. Our compensation per job grew faster than the nation only because we added hardly any jobs during these four years.
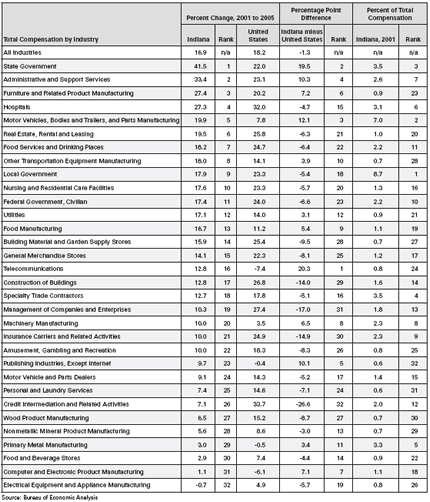
Table 1 is derived from total compensation figures by industry for Indiana and the nation. The industries shown had to meet two conditions:
Table 1
Total Compensation by Industry, 2001 to 2005
- They had to constitute more than 0.05 percent of Indiana’s total compensation in 2001 because we do not want to deal with industries that are very small contributors to the state’s economy.
- They had to have a growth rate differential from the national growth rate of ±3 percent so that we were not dealing with insignificant differences.
The industries in Table 1 are shown in rank order of their total compensation growth rate. Thus, Indiana state government at 41.5 percent had the fastest growth rate in total compensation between 2001 and 2005. This was the second highest differential from the same industry’s national counterpart. In 2001, state government represented 3.5 percent of total compensation in the state.
The ten Indiana industries doing best relative to the nation represent 20.5 percent of the state’s total compensation. In this top ten, six industries are involved in manufacturing. The bottom ten (starting with federal civilian government) equal 13.9 percent of that total. In the bottom ten, only one industry is engaged in manufacturing. Note that amusement, gambling, and recreation ranks only twenty-second in growth rate at 10 percent compared to the all industry rate of 16.9 percent and below the national rate of 18.3 percent for that industry. Is this why there is a desire to increase gambling in the state? Credit intermediation, Indiana’s most lagging industry, is the federal government’s term for banks, credit unions, and similar institutions that take deposits and make loans.
Indiana Among the States
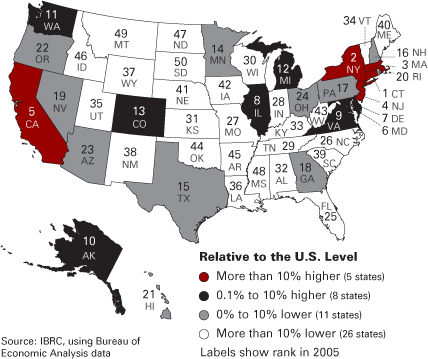
Indiana’s average compensation per job ranked twenty-seventh among the states in 2001 and, despite growing by $6,341, ranked lower at twenty-eighth in 2005. The financial giants (Connecticut—$63,279, New York, Massachusetts, and New Jersey) ranked first to fourth. At the bottom of the list was South Dakota with an average compensation per job of $36,123, followed by Montana, Mississippi, and North Dakota (see Figure 4). These are rankings among the fifty states because the District of Columbia is not included in the ranking. The District of Columbia had an average compensation per job of $84,120 in 2005, which was 69 percent above the United States; its growth rate was 4.8 percent from 2001 to 2005.
Figure 4
States’ Compensation per Job Relative to the United States, 2005
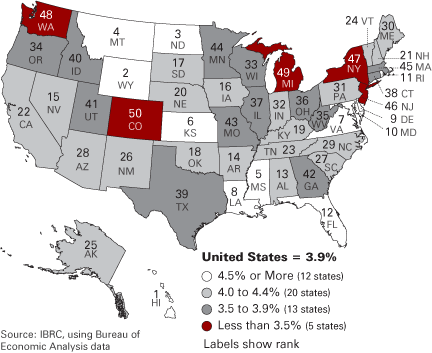
With an average annual growth rate of 3.96 percent, Indiana ranked thirty-second among the states. As shown in Figure 5, our neighbors Illinois, Ohio, Michigan, and Wisconsin all ranked below us; Kentucky came in at 4.3 percent (nineteenth). There was no meaningful relationship between the level of compensation per job and the rate of growth in that figure; thus, the rich states are not getting richer while the poor states are failing to keep pace.
Figure 5
Percent Change in Compensation per Job, 2001 to 2005
Indiana Counties
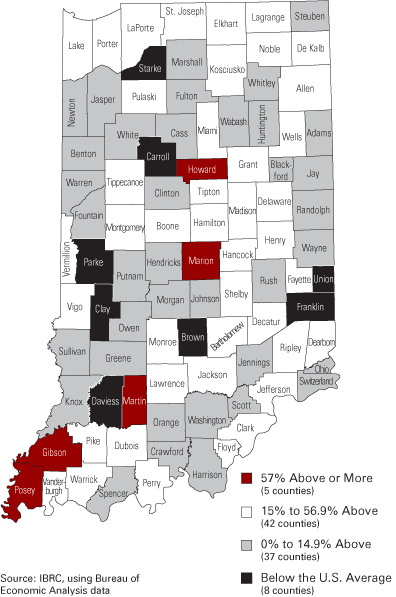
Some may find it strange, but Martin County, at $70,645, had the highest compensation per job in Indiana in 2005. The presence of high paying jobs at Crane and the paucity of other jobs allowed this south-central Indiana county to enjoy such status. The next highest paying jobs were found in Howard, Gibson, Posey, and Marion counties (see Figure 6). The lowest average paying jobs were located in Brown ($27,104), Franklin, and Parke counties.
Figure 6
Counties’ Compensation per Job Relative to the U.S. Average, 2005
With a statewide level of $44,095 in 2005, the median value for Indiana’s 92 counties was $38,391. This gives us some indication that the counties with more jobs also tend to be those with the higher paying jobs. The ratio of the statewide level to the median declined slightly from 1.17 in 2001 to 1.15 in 2005, indicating a small movement toward county-level equality in compensation per job.
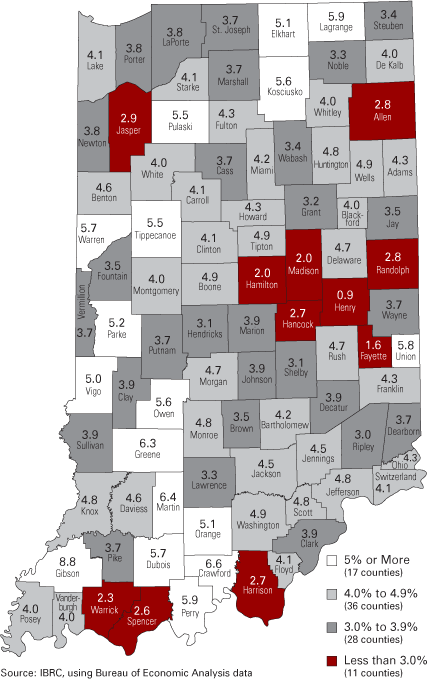
Growth of compensation per job had no relationship to the level of compensation. The highest average annual rate of growth from 2001 to 2005 (8.8 percent) was found in Gibson County. Henry County held the ninety-second position with an average annual growth rate of 0.9 percent (see Figure 7).
Figure 7
Percent Change in Compensation per Job, 2001 to 2005
Conclusion
This article shows that we have achieved one of our state’s economic goals (higher compensation per job) without much job growth. Often news releases and headlines about expansions and new firms (or contractions and closings) emphasize the jobs gained (or lost) with less attention to the dollars attached to those jobs. What would be our choice if we had to (and could) choose between more jobs and better paying jobs?


