New Albany
Indiana University Southeast
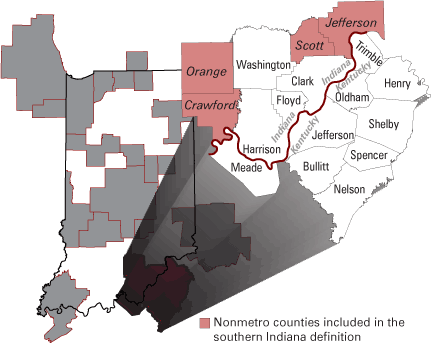
During 2006, the southern Indiana economy showed mixed signals. Job growth was up in Floyd and Clark counties, but down in the rural counties (see Figure 1). Manufacturing job losses continued in six southern Indiana counties, but we observed gains in Floyd and Clark. While southern Indiana unemployment rates remained above Indiana and U.S. averages, overall employment and labor force estimates were up compared to September 2005. Recent expansion announcements by local companies should contribute to further gains in the number of jobs. However, a decline in construction investment as a result of the drop in housing permits may contribute to a loss of construction jobs and also dampen retail sector growth and jobs. Signals are mixed, and therefore the outlook for southern Indiana is guarded.
Figure 1
Louisville, KY-IN Metro Area
Labor Markets
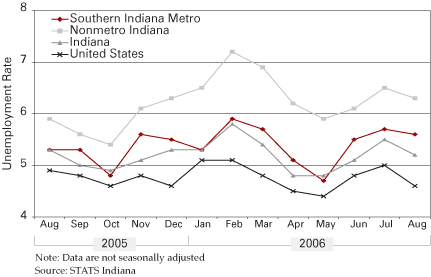
The Unemployment Picture: Unemployment rates showed a slight increase in the four southern Indiana metro counties when comparing third quarter 2005 to third quarter 2006. A similar pattern was also observed in the non–metro counties.
On a positive note, labor force participation and the number of employed persons are up across all four southern Indiana metro counties and the four nonmetro counties. Despite the gains in employment, southern Indiana rates continue to hover above state and national averages. The unemployment picture showed an improvement in September 2006, thus signaling a positive trend (see Figure 2).
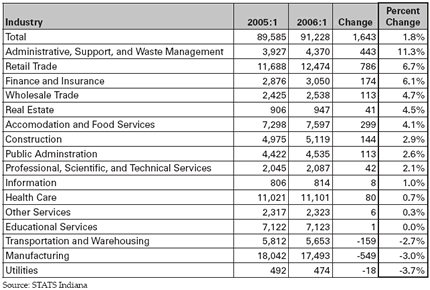
Industry Sectors: Of the approximately 1,643 jobs added in the southern Indiana metro counties, from first quarter 2005 to first quarter 2006, Clark County alone was responsible for a net gain exceeding 1,440 jobs.
Figure 2
Monthly Unemployment Rates
Job creation in Clark County was again fueled by the retail sector. Almost 700 of the approximate 800 new retail jobs in the four southern Indiana metro counties were added in Clark County, the bulk of these in sporting goods and building materials, with recent additions to the Veteran’s Parkway commercial corridor.
Other employment gains in the southern Indiana metro include 144 new construction jobs, 174 in finance and insurance, 443 in administrative, support and waste management, 299 in accommodation and food services, and 113 in public administration. Health care added only 80 jobs, and education was flat. A discouraging number was the loss of 150 jobs in the transportation and warehousing sector.
A net loss in jobs again occurred in the manufacturing sector with the four southern Indiana metro counties losing a combined 549 manufacturing jobs (see Table 1). This overall loss occurred despite the fact that Floyd and Clark counties added 161 manufacturing jobs, primarily in plastics and metals sectors. And even though overall manufacturing in the four total counties continues its downward trend, the four-county region did observe in increase in the wood products and metals sectors.
Table 1
Employment by Industry in Southern Indiana’s Metro Counties
Floyd, Clark, Orange, and Jefferson counties observed an increase in the number of jobs from 2005 to 2006, while the four other southern Indiana counties (Washington, Harrison, Scott, and Crawford) experienced a loss of approximately 540 jobs, primarily the result of a decline in manufacturing jobs (see Table 2). Looking beyond a single year, since the first quarter of 2001, the six rural southern Indiana counties have lost approximately 1,000 jobs, with 800 of these job losses occurring in the manufacturing sector.
Table 2
Job Growth by Suburban and Rural Counties
Bringing positive news to the southern Indiana labor picture, average weekly wages increased in southern Indiana counties. For southern Indiana metro counties, weekly wages saw an increase of about 9 percent between 2005:1 and 2006:1, from $556 to $606 per week. Nonmetro counties in southern Indiana saw an increase in the weekly wage from $528 to $569, for an increase of 7.8 percent.
Louisville Metro Employment: As a whole, the unemployment picture for the Louisville metro seems to be about the same as earlier in the year. The August unemployment rate of 5.6 percent equals the first quarter average for the metro and last year’s August rate.
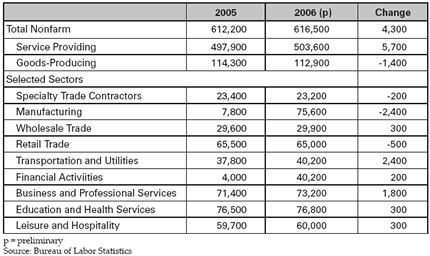
Preliminary estimates by the Bureau of Labor Statistics show that the Louisville metro added 4,300 jobs from September 2005 to September 2006 (see Table 3). The bulk of these jobs were in service-providing industries. Overall, job gains were softened by continued losses in the manufacturing sector. Over that same time period, Louisville lost approximately 2,400 manufacturing jobs, continuing a persistent trend. These job losses were offset by gains of 2,400 jobs in transportation and utilities and 1,800 jobs in professional and business services.
Table 3
Employment in the Louisville Metro Area, September of Each Year
Consumer Activity
The retail sector continues to show job gains in southern Indiana, particularly the retail center of Clark County. However, preliminary retail sector data for Louisville metro point in the direction of a small decline for retail sector jobs in the four southern Indiana metro counties. While a decline in residential construction may cause a decline or only flat growth in retail sector jobs, continued expansion of the Veterans Highway corridor will potentially mitigate a decline in retail sector jobs. As Floyd and Clark County continue to emerge as a retail destination, retail activity in the nonmetro counties will be challenged.
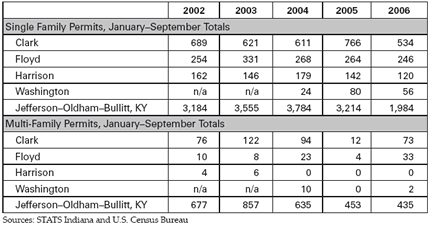
Housing Market: The housing market in southern Indiana and the Louisville metro area has cooled considerably since last year. September data for new housing permits show marked declines in all four southern Indiana metro counties (see Table 4). Single family permits were down 24 percent in the four southern Indiana metro counties and 38 percent for Kentucky’s Bullitt, Jefferson, and Oldham counties. As of mid-October, median home prices were flat, and the average days on the market for existing home sales declined from 108 to 102.1 The decline in housing construction will exert downward pressure on overall retail activity.
Table 4
Building Permits, January through September 2006
Caesars Indiana: Caesars Indiana observed another decline in turnstile counts. January to September totals were down two consecutive years (see Table 5). Plans for a change in theme and significant renovations should reverse this trend for 2007. We shall see next year the impact the new French Lick casino will have on Caesars admissions and employment in the Orange County region.
Table 5
Caesar’s Indiana, Admissions and Total Taxes, January through September
Notes
- Data on home sales from the southern Indiana Realtors Association Multiple Listing Service covers Clark, Crawford, Floyd, Harrison, Jefferson, Scott, and Washington counties.
Also in this Issue…
- Outlook for 2007
- The International Economy
- The U.S. Economy
- Financial Forecast
- Housing
- Indiana Agriculture
- Indiana
- Anderson and Muncie
- Bloomington
- Columbus
- Evansville
- Fort Wayne
- Gary
- Indianapolis
- Kokomo
- New Albany
- Richmond
- South Bend and Elkhart-Goshen
- Terre Haute
- Indiana Metro Economies at a Glance
- Return to Table of Contents


