How Does Your Garden Grow?: Employment Growth Among the States
Indiana Business Research Center, Kelley School of Business, Indiana University
Some florid orators will tell you that a state’s economy is like a garden. It must be nurtured, weeded, properly drained or absorbent enough to withstand flooding, and with an orientation toward the beneficial rays of the sun. Thus, we may ask: how have our gardens been growing?
States are an appropriate unit of analysis because there are few metropolitan economic development commissions with major authority. Only the states themselves have the power and the resources to influence economic development in a serious fashion. This said, from a purely economic point of view, the metropolitan area is probably the best unit of analysis since serious economic effects rarely spread far beyond the borders of a given metro area.
State Employment Growth, 1996 to 2006
We consider employment as the rose of the garden. Jobs are the focus of our politicians who are (whether they know it or not) tied to the Great Depression and who see one job as equal to some multiple of that number in votes.
When discussing the economy of states, it is inappropriate to compare the growth rate of any given state to the national growth rate. The national growth rate is not the average of the fifty states, but rather the growth rate for the United States, which is the sum of employment in all of the states. This is equal to the weighted average where California’s growth rate counts for nearly forty-three times more than the growth rate of North Dakota.
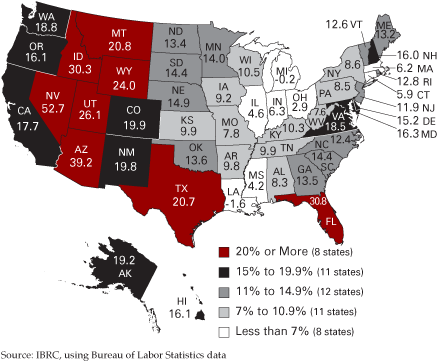
The national employment growth rate from 1996 to 2006 was 13.4 percent. (1) This was also the median growth rate, dividing the top twenty-five states from the bottom twenty-five. The highest rate was realized by Nevada with 52.7 percent and the lowest rate (excluding hurricane-ravaged Louisiana) was -0.2 for Michigan. Indiana was forty-third in the nation with a 6.3 percent rate of growth, half the national pace.
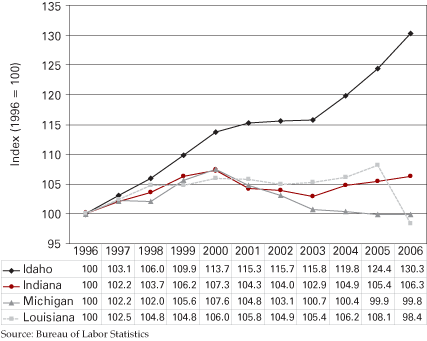
Figure 1 presents the employment pathways followed by four states. Many states followed the same pattern as Idaho over this period of time: A basic upward trend, interrupted by a softening of job growth early in this decade, then resumption of growth. Indiana, Michigan, and Louisiana followed their own lower but similar path until a clear divergence appeared among the three in 2002. The effect of Hurricane Katrina on Louisiana is evident for 2006. The split between Indiana and Michigan grew over the latter years of the time span. Figure 2 offers the growth rates for all states. Western states predominate as the fastest growing areas. Four Midwestern and two New England states were the slowest growing, along with Katrina-battered Louisiana and Mississippi.
Figure 1
Employment Trends in Selected States, 1996 to 2006

Figure 2
Growth Rates in Employment, 1996 to 2006

Annual Growth
The fastest rate of growth for any state was 6.5 percent for Nevada in 2004, while Arkansas never grew faster than 1.9 percent in any of the past ten years. Indiana’s peak year of growth occurred in 1999 at a rate of 2.5 percent, which placed us thirty-eighth in the nation.
This past year, jobs in Louisiana declined by 9 percent, the most of any state in the past ten years. Aside from that tragic circumstance, Indiana had the greatest annual decline in jobs back in 2001 at -2.8 percent. Perhaps it needs to be repeated, except for Louisiana last year, no state had a more serious decline in employment in the past ten years than did Indiana in 2001.
Variation in Employment Growth
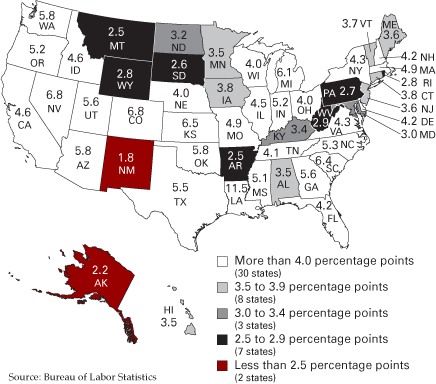
The range of the percent change in employment (that is, the maximum and minimum values for each state) gives us one measure of volatility. These ranges are represented in Figure 3. Again we must discount the result for Louisiana where the range was 2.5 percent to -9.0 percent, or 11.5 percent. Next on the list were Colorado and Nevada with ranges of 6.8 percent. The least spread between its highest growth rate and its lowest was New Mexico, with a growth peak of 2.9 percent and a trough of 1.1 percent. Indiana ranked fourteenth in this measure with a range of 5.2 percent, from 2.5 percent to -2.8 percent. (2)
Figure 3
Variation in Employment Growth, 1997 to 2006

Volatility in Employment Growth
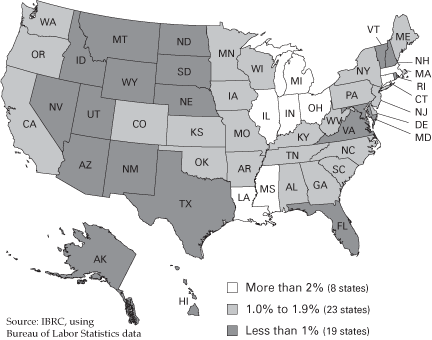
The range tells us about the highs and the lows of a set of values, in this case two observations out of ten. But the volatility of change is measured by how much the change of each year is away from the average or the mean value of a series. For Indiana, the average percent change in jobs over these past ten years has been 0.6 percent (forty-third in the nation). The measure of distance from that average is called the standard deviation; this was 1.6 percent for Indiana (seventeenth in the United States). When the standard deviation is divided by the average, we have a coefficient of variation, a measure that applies across all states regardless of differences in their average growth rates. (3) The coefficient of variation for Indiana was 2.6 (the standard deviation was more than two-and-a-half times as great as the mean), which put Indiana in seventh place across the nation for volatility of job growth. Michigan showed the greatest volatility of job growth, meaning it had the greatest variance around its average value. The most placid job market was in New Mexico (see Figure 4). A high level of job growth may be desired. But do we want a high degree of variation in that rate of growth? Does a boom/bust scenario seem desirable?
Figure 4
Volatility in Job Growth, 1997 to 2006

And do these questions make any sense if we cannot control the behavior of the job market?
To know what has been happening and what may therefore happen again is useful. To believe that by such knowledge we can rein in either growth or volatility, that we can accelerate lagging performance for a state with a vigorous private market, could be a significant and embarrassing vanity.
Notes
- All data used are seasonally adjusted figures for the month of July as provided by the U.S. Bureau of Labor Statistics. The data for July 2006 are preliminary. Data for the District of Columbia have been excluded since that entity shares economic power over the jurisdiction with the federal government.
- Numbers may not add because of rounding.
- There is a problem, however, when the mean or average value in the denominator is very close to zero, the coefficient of variation will get very large. Thus, states with little or no change on average, will show dramatic statistical volatility that a reasonable person would not recognize as valid.


