
In the Zone: A Look at Indiana's Enterprise Zones
Indiana Legislative Services Agency
Indiana University Southeast
Over the past several decades, state and local governments have become more active in promoting economic development, and Enterprise Zones (EZs) have become a common tool.(1) Forty-three states currently provide incentives for businesses to locate or expand in these distressed and blighted areas, which are often traditional downtown areas or old industrial and manufacturing areas that have gone through a protracted period of decline. Typically, EZ incentives consist of tax instruments, such as property tax abatements, income tax deductions and credits for employment creation, capital investment, and income creation in the EZs. At the present time, Indiana has twenty-five municipal EZs and three EZs located on closed military bases (see Figure 1).
Figure 1
Indiana EZ Locations
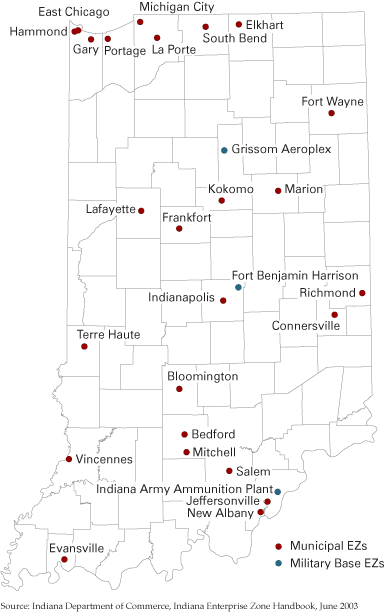
EZ Designation
Indiana’s Enterprise Zone (EZ) program was established in 1983 and allows EZs to be located in municipalities or on closed military bases.
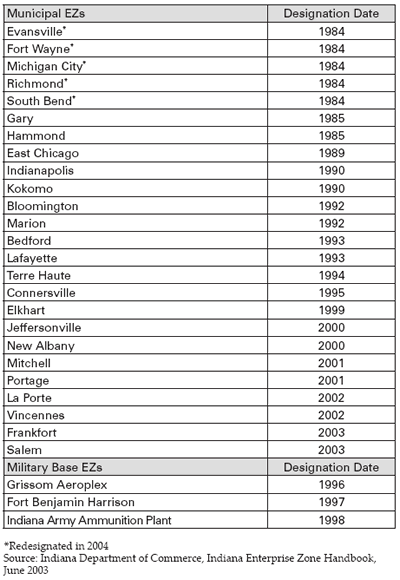
The Indiana Economic Development Corporation (IEDC) administers the EZ Program and has the power to review and approve applications for proposed EZs, renew existing EZs, and monitor EZ operations and incentive use. EZs are designated based on demographic, socioeconomic, and geographic size criteria. The initial designation period for an EZ is ten years, with EZs eligible for two five-year renewals based on performance reviews by the IEDC Board. In addition, EZs that have operated for a full twenty-year period may be redesignated for a new term with an initial ten-year designation period by the IEDC Board.(2) The IEDC Board is currently authorized to designate two new municipal EZs each year until December 31, 2015. Table 1 shows Indiana EZs and the year each was initially designated.
Table 1
Indiana EZ Designation Dates
EZ Incentives
The following describes the tax incentives, which serve as recruitment tools for the EZs. Note that the Employment Expense Credit and the Loan Interest Credit are applicable to three state taxes: income tax, financial institutions tax, and insurance premiums tax. The Investment Cost Credit, however, is only applicable to the state income tax.
Inventory Tax Credit: This credit eliminates the property tax on wholesale or retail merchandise being held for resale as well as finished goods maintained by a business in an EZ. Before 2004, it also eliminated property tax on work-in-process and raw materials incorporated in finished goods for shipment out of state. Such inventory was exempted from property tax statewide beginning in 2004. More importantly, the credit will be inoperative beginning in 2007, once the inventory tax is eliminated statewide through the 100 percent inventory deduction.
Investment Cost Credit: This is a state tax credit for equity investment in an EZ business. The credit is equal to a maximum of 30 percent of the price of the ownership interest purchased by the taxpayer. The allowable credit percentage, up to 30 percent, varies depending upon the type of investment, the type of business, and the number of jobs created by the investment.
Employment Expense Credit: This is a state tax credit for incremental wages paid by an EZ business to employees who are EZ residents. At least 90 percent of the employee’s services must be directly related to the EZ business, and at least 50 percent of the employee’s time must be spent working at the EZ business. The credit is equal to 10 percent of the additional wages paid to qualified employees during the year, up to $1,500 per qualified employee.
Loan Interest Credit: This is a state tax credit for interest income earned by a taxpayer from a loan that directly benefits an EZ business, increases EZ property values, or is used to rehabilitate, repair, or improve an EZ residence. The credit is equal to 5 percent of the loan interest received during the year.
Property Tax Investment Deduction: This is a new deduction enacted during the 2005 legislative session, and it became effective July 1, 2005. It is a property tax deduction for the increased value of an EZ business property due to real and personal property investment by the business. The added valuation may be deducted for up to ten years. Qualified investment at an EZ location includes: (1) purchase of a building, new manufacturing or production equipment, or new computers and related office equipment; (2) costs associated with the repair, rehabilitation, or modernization of an existing building and related improvements; (3) onsite infrastructure improvements; (4) construction of a new building; and (5) costs associated with retooling existing machinery.
Gross Income Tax Exemption: Historically, this incentive was utilized more than any except for the Inventory Tax Credit, but it no longer exists.
Incentive Savings
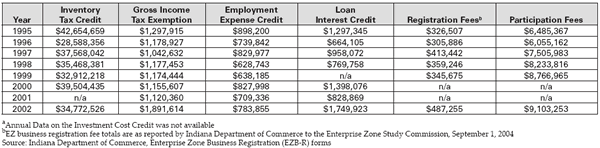
Table 2 reports annual savings from these tax incentives as reported to the Indiana Department of Commerce (IDOC). Since 1995, the reported savings from the Inventory Tax Credit averaged about $35.9 million per year. Next was the Gross Income Tax Exemption with annual savings averaging only about $1.3 million. During this period, the Inventory Tax Credit accounted for about 92 percent of incentive dollars. In 2002 (the most recent year available), the Inventory Tax Credit, totaling about $34.8 million, generated 88.7 percent of the incentive savings.
Table 2
Incentives and Fees for EZ Businesses, 1995 to 2002a
Click for larger image
EZ Administration and Funding
Businesses receiving more than $1,000 in EZ tax incentives must pay an annual registration fee (equal to 1 percent of the incentives received during the year) to the state to participate. Since 1995, business registration fees paid to the state have averaged about $373,000 annually. In 2002, registration fees totaled about $487,000, also shown in Table 2.
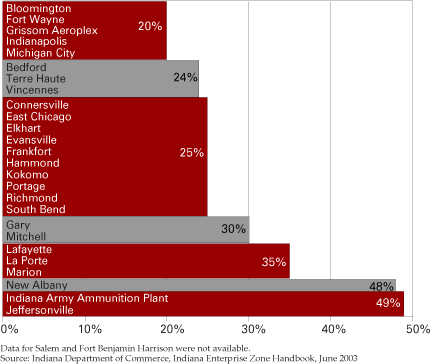
The day-to-day operation of each EZ is managed by a local nonprofit entity called an Urban Enterprise Association (UEA). Each business that obtains EZ tax incentives must contribute to the local UEA through a business participation fee equal to a percentage of the incentives received during the year. Thus, the tax incentives serve as both a business recruitment tool and the source of funding for the UEAs, thereby determining the funding available for various community and economic development programs that may be pursued by the association. The participation fee imposed by UEAs across the state ranges from a low of 20 percent to a high of 49 percent (see Figure 2). Since 1995, participation fees paid to the UEAs have averaged about $7.7 million annually. With the Inventory Tax Credit accounting for nine-tenths of incentive dollars, it has been the primary source of UEA funding. In 2002, participation fees totaled $9.1 million.
Figure 2
Indiana EZ Participation Fees, 2002
EZ Residents
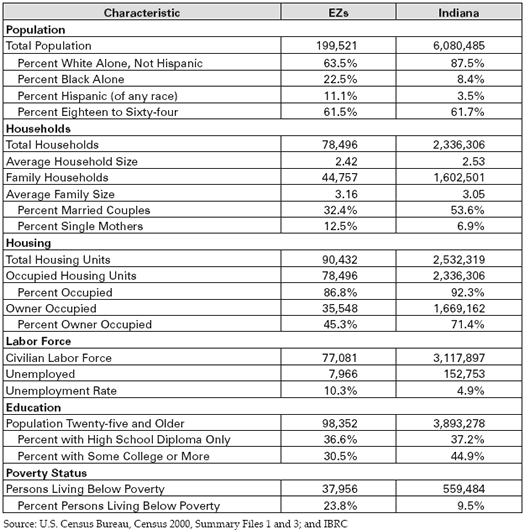
Almost 200,000 people, or about 3.3 percent of Indiana’s population, reside in the twenty-eight EZs, with household units in the EZs (about 78,000) representing a similar share of the state total. The proportion of family units in the EZs is lower, with almost 45,000 family households representing only about 2.8 percent of the state total. Racial and ethnic minorities comprise a much higher proportion of the EZ population than of the statewide population. Blacks comprise 22.5 percent of the EZ population (almost triple the statewide share), and Hispanics comprise 11.1 percent of the EZ population (more than tripling the statewide share). The composition of families in EZs is also quite different than it is statewide. The share of EZ families containing married couples (32.4 percent) is almost 40 percent below the statewide share (53.6 percent), and the percentage of single mothers in EZ families (12.5 percent) is almost twice as high as the statewide percentage (6.9 percent).
Table 3 confirms that EZs are located in the economically distressed and blighted areas they were intended to serve. While 9.5 percent of persons statewide live below the federal poverty level, the share of EZ residents living in poverty is two and a half times higher at 23.8 percent. Although about 3.3 percent of the state population resides in the twenty-eight EZs, almost 6.8 percent of the statewide population living below the federal poverty level resides in EZs. Likewise, the unemployment rate for EZ residents (10.3 percent) is more than twice the statewide rate (4.9 percent), representing about 5.2 percent of the state’s unemployed, according to Census 2000. Compared to the population and household unit representation of EZs, only about 2.1 percent of the owner-occupied housing in Indiana is located in EZs. Furthermore, the portion of owner-occupied housing in EZs (45.3 percent) is substantially lower than the statewide share (71.4 percent), suggesting a much higher potential for blight.
Table 3
Demographic and Socio-Economic Characteristics of Indiana and Indiana EZs,
2000
Click for larger image
Business Characteristics
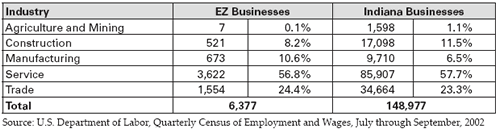
Indiana’s twenty-eight EZs contain almost 6,400 businesses in five industry sectors (the totals exclude government and nonprofit entities).(3) This comprises about 4.3 percent of the statewide total number of businesses in these five industry categories (see Table 4). The EZs contain heavy concentrations of service and trade businesses, which account for about 80 percent of the EZ business total.
Table 4
Indiana Businesses by Industry Sector, 2002
Click for larger image
The deviation between the EZ and statewide business distributions arises in the construction and manufacturing industries. The EZs have a heavier concentration of manufacturing businesses with a 10.6 percent share (the manufacturing share statewide is only about 6.5 percent). More notable is that EZ manufacturing businesses (673 establishments) account for almost 7 percent of the statewide total manufacturing businesses (9,710 establishments). In contrast, construction is less concentrated in EZs at about 8.2 percent to a statewide share of about 11.5 percent. This discrepancy makes sense, as the EZs tend to be concentrated in older industrial/manufacturing areas of cities such as East Chicago, Elkhart, Evansville, Fort Wayne, Hammond, Indianapolis, and South Bend. The high incidence of manufacturing and trade businesses in the EZs (presumably with large amounts of raw materials, unfinished and work-in-process goods, and inventory held for resale) likely explains the comparatively high utilization of the Inventory Tax Credit.
The conceptual basis and practical application of EZ programs has typically centered on the redevelopment of economically distressed and blighted urban areas. However, nine of Indiana’s EZs are situated in more rural settings:(4) Bedford, Connersville, Frankfort, Marion, Mitchell, Richmond, Salem, Vincennes, and Grissom Aeroplex. As shown in Table 5, a total of 1,422 businesses are located in the rural area EZs (about 22 percent of the total for all EZs). The service and trade sectors account for almost 87 percent of the rural area EZ businesses. This is about 8 to 9 percentage points higher than both the statewide and urban area EZ service and trade sector shares. In contrast, the rural area EZs exhibit construction and manufacturing shares that are roughly 3 to 4 percentage points lower than in the urban area EZs. Interestingly, the agriculture and mining industry shares for rural area and urban area EZs are essentially the same.
Table 5
Rural and Urban EZ Businesses by Industry Sector, 2002

Click for larger image
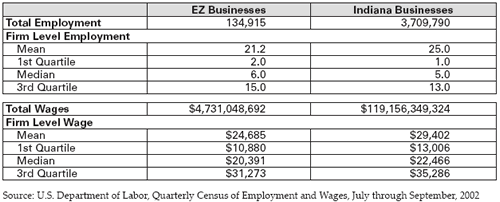
Employment: Total business employment in Indiana’s twenty-eight EZs is almost 135,000, or about 3.6 percent of the statewide total of about 3.7 million.(5) The firm level employment measures suggest that the average EZ business is somewhat smaller in terms of employment than are businesses generally in Indiana. However, the mean, median, and quartile measures suggest that EZ businesses are not markedly different than Indiana businesses overall in terms of their employment scale (see Table 6). An interesting facet of the firm level employment statistics is, however, the extent to which mean employment is positively skewed. It is quite clear that reliance on the mean would provide a rather distorted view of the employment levels.
Table 6
Employment and Wage Levels of Indiana and EZ Businesses
Click here for larger image
Actually, half of the EZ businesses employ fewer than six people and 75
percent employ fewer than fifteen people. This distribution mirrors the
distribution of business employment statewide and suggests that the majority
of EZ businesses are rather small-scale businesses. Thus, local UEAs must
be acutely aware that much of their clientele does not have large numbers
of administrative, accounting, and financial support personnel to facilitate
application and reporting processes that tend to accompany economic development
incentive programs. The more effective incentive programs may be those that
minimize or simplify paperwork and reporting requirements and rely less
on offsetting net income tax liabilities.
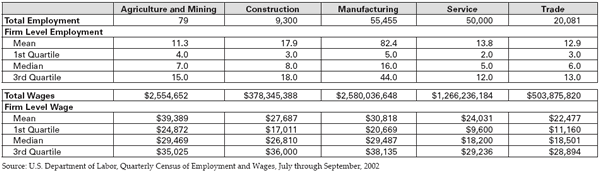
The dominant industry sectors for employment in Indiana’s EZs are,
by far, the manufacturing and service sectors (see Table 7).
The manufacturing sector accounts for almost 55,500 EZ jobs or about 41
percent of total employment in the EZs. The service sector accounts for
50,000 EZ jobs, 37 percent of the EZ total. Firm level employment for EZ
businesses does not vary markedly among the industry sectors except for
the manufacturing sector. On average, EZ businesses in the agriculture and
mining, construction, service, and trade sectors employ fewer than twenty
people.
Table 7
Employment and Wage Levels of EZ Businesses by Industry Sector
Click for larger image
Conversely, the manufacturing employment measures indicate the presence of some large-scale production facilities, with a mean firm level employment of eighty-two employees and the top 25 percent of manufacturers exceeding forty-four employees. The manufacturing totals also reveal a sizeable number of surprisingly small manufacturing establishments in the state, with 50 percent having fewer than sixteen employees.
Wages: Annual wages earned by employees of EZ businesses total about $4.7 billion, accounting for about 4 percent of the statewide total of approximately $119.2 billion. The firm level measures suggest that the average EZ business pays about 16 percent less than businesses statewide—an average of $24,685 in EZs to $29,402 statewide. The firm level wage measures reveal a positive skew to wages overall and for EZ businesses, albeit less pronounced for EZ businesses. The median and quartile measures are, again, informative. While EZ businesses, on average, pay just under $25,000, the other measures indicate that half of the firms pay wages, on average, of less than $20,391 (see Table 6). The EZ wage is less than the statewide wage by anywhere from about 9 percent on the median to about 16 percent on the mean.
Employees of EZ manufacturing firms earn far better salaries, over the entire wage distribution, than is generally the case in the other industry sectors (see Table 7). However, at the top end of the wage distribution, construction does appear to fall more into line with manufacturing wages. The measures also highlight the much lower wage structures present in the service and trade sectors. Seventy-five percent of service and trade sector businesses in the EZs have a firm level average wage of less than $18,500. At the same time, 75 percent of manufacturers in the EZs have a firm level wage exceeding $20,000; and 75 percent of construction businesses have a firm level wage exceeding $17,000.
Conclusions
Over the 1995 to 2002 period, the average incentive savings from the credits and exemptions available to EZ businesses was $38.9 million. The average registration fee paid to the state and participation fee paid to the local UEA was $373,000 and $7.7 million, respectively. An EZ resident is substantially more likely to be a racial or ethnic minority, live in a household headed by a single female, rent, be unemployed, and live in a household with income below the poverty level than a resident of the state as a whole. EZ businesses are also more concentrated in the manufacturing and trade sectors than is the case statewide. The average level of employment and average wages in EZ businesses are lower than those of the state as a whole. Among EZ businesses, the manufacturing sector employs the most workers followed by the service sector. Also, the agriculture and mining sector (albeit comprising a very small share of EZ employment) has the highest average wage level followed by the manufacturing and construction sectors.
Notes
- This article was derived from a Fiscal Issue Brief published by the Indiana Legislative Services Agency, and is available at www.in.gov/legislative/pdf/FISCAL_ISSUE_BRIEF_-_INDIANAS_ENTERPRISE_ZONES.PDF. It results from the Enterprise Zone Fiscal Impact Project. The study and its maps can be accessed at www.in.gov/legislative/pdf/INDIANA_ENTERPRISE_ZONE_FISCAL_IMPACT_PROJECT.PDF.
- In 2004, EZs in Evansville, Ft. Wayne, Michigan City, Richmond, and South Bend were redesignated after completing a twenty-year term.
- The construction industry category and the manufacturing industry category are each two-digit NAICS industry sectors, while the trade industry category combines the two-digit NAICS retail trade and wholesale trade industry sectors. The agriculture and mining industry category combines the two-digit agriculture, forestry, fishing and hunting NAICS industry sector with the two-digit mining NAICS industry sector. The service industry category combines thirteen two-digit NAICS industry sectors: (1) utilities; (2) transportation and warehousing; (3) information; (4) finance and insurance; (5) real estate and rental and leasing; (6) professional, scientific and technical services; (7) management of companies and enterprises; (8) administrative and support and waste management and remediation services; (9) educational services (for-profit only); (10) health care and social assistance (for-profit only); (11) arts, entertainment, and recreation (for-profit only); (12) accommodation and food services; and (13) other services (except public administration).
- To delineate these EZs, we use the U.S. Census definition for an urbanized area; this includes a large, central area and a densely populated surrounding area, which must have a combined total of at least 50,000 people.
- Government and nonprofit organizations are excluded from the employment and wage totals.
