Projecting Reapportionment
Indiana Business Research Center, Kelley School of Business, Indiana University
When our country’s forefathers penned the U.S. Constitution, one of the first things they established was that our population would be enumerated every ten years.(1) Their motivation was to create a fair basis for allocating the seats of the House of Representatives to individual states. Today, this imperative continues to bestow upon the U.S. Census Bureau its foremost purpose.
The results of the 2000 Census led to the loss of one House seat for Indiana—a decrease from ten representatives to nine. Regardless of the fact that Indiana gained population during the 1990s, we lost that seat because many other states outpaced our growth, especially in the southern and western regions of the nation. This is part of a trend over recent decades where states in the Northeast and Midwest have lost seats, and states in the South and West have gained seats. There are no indications that this trend will change anytime soon. In light of this, how might Indiana’s representation change in the coming decades, and what shifts in representation can we expect between regions? This article explores these two questions.
Allocating Seats
The House of Representatives is fixed at 435 seats and has been since the reapportionment following the 1910 Census (with the exception of temporarily having 437 seats when Alaska and Hawaii joined the nation). Each state is guaranteed at least one seat. The remaining 385 seats are allocated via an approach called the method of equal proportions.(2) Congress adopted this method in 1941, and it has been applied to the results of every census since 1940.
The first step of this method is to calculate a set of multipliers, each associated with a particular House seat beyond the first guaranteed seat (i.e., a separate multiplier for any state’s second seat, third seat, etc.). In general, the following formula gives the multiplier for a state’s nth House seat:

Therefore, the multiplier for a state’s second House seat would be 1/v2(2-1) or 0.707. It is necessary to create enough multipliers to accommodate the most populous state, California, which currently holds fifty-three seats. Based on existing population growth trends, we would expect to need more than fifty-three multipliers in the coming decades.
In the next step, each state’s apportionment population is multiplied by each multiplier to create a list of priority values. Note that the apportionment population includes the overseas population, consisting of federal employees (military and civilian), as well as their dependents, who can be allocated to their home state based on administrative records. After the priority values are calculated for all states, they are combined into a single list and sorted from high to low. The top 385 priority values determine where House seats fifty-one through 435 will be assigned. (Recall that the first fifty House seats are assigned one per state, regardless of population.)
After Census 2000, the highest priority value was for California’s second seat (the House’s fifty-first seat), calculated as 0.707(33,930,798) = 23,992,697. Texas was the next state to obtain its second seat with a priority value of 14,781,356. Indiana picked up its second seat (the eightieth House seat) with a priority value of 4,306,833.(3)
As noted, in recent decades the relative shift of population growth from the Midwest and Northeast to the South and West regions has tipped the scales of representation. This not only affects our representation in Congress, but also our relative voice in presidential elections (each state’s number of electoral votes is equal to its number of representatives and senators). This leads many citizens in our area of the country to wonder what is in store for us as time goes on.
Projecting Reapportionment
To project future reapportionment, we began with the Census Bureau’s projections of state-level resident populations through 2030, released in April 2005.(4) To find the projected apportionment populations, we first created our own projections of the overseas population for each state (recall that apportionment population = resident population + overseas population). For this step, we calculated the ratio of the overseas population to the resident population for each state according to the 2000 Census; then we simply multiplied those ratios by the Census Bureau’s state resident population projections for 2010, 2020, and 2030 to project the overseas populations in those years.
Projections for the national overseas population were generated in the same manner and served as controls for the state-level overseas population projections. As a result, the state-level projections for each year were adjusted so that their sum would equal the national projection. The controlled projections were then added to the respective state resident population projections to arrive at the projected apportionment populations.
This approach rests on the assumption that a state’s overseas population will change in proportion to the changes in its resident population, which is a tenuous assumption at best. In 2000, however, the U.S. overseas population was only 0.2 percent of the resident population, and the highest percentage at the state level was 0.4 percent (Hawaii). Hence, this component of the analysis has a negligible impact on our reapportionment projections. If we were to completely ignore the overseas population, we would obtain nearly identical results.
Hoosier Representation
How will Indiana’s representation fare in the coming decades? We are pretty well assured of keeping our ninth seat in 2010. However, in 2020, Indiana is “on the bubble,” and it is uncertain whether we will retain our ninth seat. By the time the 2030 Census results are tallied, it seems very likely that Indiana will be left with only eight seats.
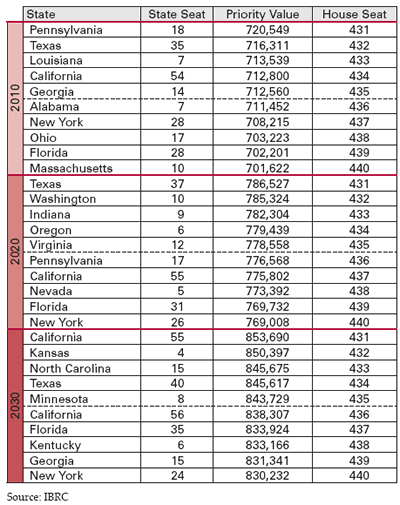
Who is projected to be on the bubble after the 2010 Census? Table 1 shows the last five states projected to pick up seats, as well as the next five states in line for a seat. For the 2010 projection year, Indiana’s ninth seat is well away from the bubble at House seat number 414, with a priority value of 754,588. We have considerable confidence in this projection due to its short-term nature.
Table 1
Seats on the Bubble, 2010 to 2030

Projections for seats on the bubble in 2020 include Indiana at House seat number 433. While it seems our ninth seat will be in jeopardy, our eighth seat comes in safely at House seat number 377 with a priority value of 887,050.
California appears twice for seats on the bubble in 2030 and is likely to end up with anywhere from fifty-four to fifty-six seats. A ninth seat for Indiana appears to be out of the question after Census 2030, as that seat is projected to be well beyond the bubble at number 455 with a priority value of 803,907. At least our eighth seat seems secure, coming in at the 401st House seat with a priority value of 911,545.
Musical Chairs
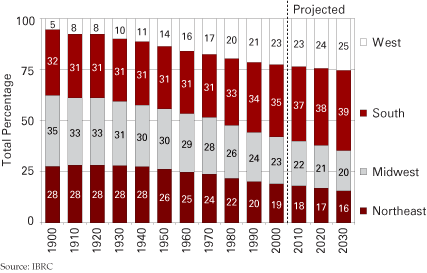
How has the geographic concentration of representation changed over the past century, and what is the expected magnitude of future shifts? Figure 1 shows the percentage breakdown of House seats by region since 1900, as well as the projected breakdowns through 2030. The South and West regions combined currently account for 58 percent of House seats, whereas that figure was only about 37 percent one hundred years earlier. Note that this combined area is expected to account for about 64 percent of House seats in 2030, meaning it will account for about the same percentage of seats as the combined Northeast and Midwest regions had after the 1900 Census.
Figure 1
Projected Change in House Seats, 1900 to 2030

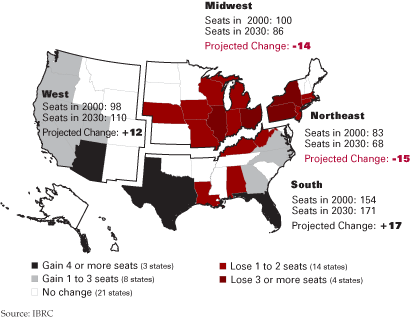
Figure 2 shows the expected shifts in representation from Census 2000 to Census 2030. Over the thirty-year period, the South and West regions combined are expected to gain twenty-nine seats from the combined Northeast and Midwest regions. The West is the only region where none of the individual states are expected to lose any seats. In contrast, none of the states in the Northeast and Midwest regions are expected to gain seats.
Figure 2
Expected Shifts in Representation, 2000 to 2030
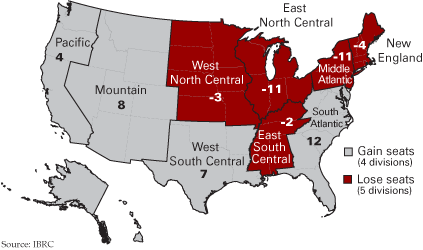
Figure 3 shows the shifts of seats between Census divisions (subsets of the regions shown in Figure 2). Note that not all divisions in the South region are expected to gain seats—the East South Central division is expected to lose two seats. A total of four Southern states are expected to lose one seat each.
Figure 3
Shifts of Seats between Census Divisions, 2000 to 2030

Time to Reevaluate the Procedure?
One of the reasons the West and South regions have such high population growth, aside from warm weather, is their relatively high levels of immigration. Perhaps some are not aware that noncitizens, including illegal aliens, are counted as part of the apportionment population. Is this fair to voters in states that have relatively low immigration, such as Indiana? Notable testimony related to that question comes from the Center for Immigration Studies, which reported that Indiana would not have lost its tenth House seat in 2000 if illegal aliens had been excluded from the apportionment population.(5)
According to Census Bureau estimates, California’s noncitizens comprised about 16 percent of the state’s population in 2000, whereas that figure was only about 2 percent for Indiana. The estimate for the nation is 6.6 percent, so the ten states that exceed that mark gain a “political voice premium” at the expense of the states below it. Is it fair for citizens of states such as California, Texas, and Florida to have an increased influence on presidential elections due to the relative prominence of noncitizens in those states? Should noncitizens have representation in Congress? Excluding them is not as straight-forward as it sounds, however, and would likely result in litigation ending up in the Supreme Court. Although we will not dig further into these questions here, suffice it to say we believe they will need to be more adequately addressed at some point.
Notes
- You may view the relevant language within Article 1, Section 2, Clause 3 of the U.S. Constitution at www.archives.gov/national-archives-experience/charters/constitution.html.
- Details regarding the calculations are presented online at www.census.gov/population/www/censusdata/apportionment/computing.html.
- For more details about the reapportionment for Census 2000, see More Hoosiers, Less Representation in the Spring 2001 issue of this publication, available at www.ibrc.indiana.edu/ibr/2001/spring01/02.pdf.
- The Census Bureau’s state population projections are available for download from www.census.gov/population/projections/.
- Camarota, Steven A., Dudley L. Poston Jr., Amanda K. Baumle, "Remaking the Political Landscape: The Impact of Illegal and Legal Immigration on Congressional Apportionment," October, 2003. http://cis.org/ImmigrationEffectCongressionalApportionment.


