Government Spending and Efficiency
Calumet College of St. Joseph
Overall, the difference in spending between high- and low-cost cities and towns can be quite large. Caution must be used in comparing municipal budgets, however, because urban municipalities are responsible for some kinds of services not incurred by towns and cities located in rural and suburban settings. The cost of police and fire protection, for instance, differs greatly.
Municipal Budgets Per Capita
Excluding police and firefighter pensions, towns and cities in Lake County spent, on average, $359 per resident in 2003. (Data for Lake Station were not available at the time the analysis was conducted.) Two cities exceeded this average by wide margins (see Figure 1). The City of Whiting spent $1,071 per person in 2003 and the City of East Chicago spent $634 on a per capita basis. If we exclude these two outliers, the average for all towns and cities falls to $317 per person. The City of Whiting exceeded this revised average by 338 percent.
Figure 1
Per Capita Municipal Budget Amounts
Click for larger image
Public Education
Schools account for as much as 50 percent of the property tax bill in some taxing districts. Judging whether or not these dollars are well spent can be challenging. Four sets of data are revealing, however: cost per student, ISTEP scores, student/teacher ratio, and administrative overhead expenditures.
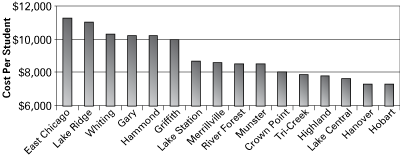
On average, school districts statewide spent $8,550 per child over the course of the 2003-2004 school year. Six of the sixteen school districts in Lake County exceeded this average by more than 15 percent (see Figure 2): East Chicago Schools by 32.1 percent ($11,300), Lake Ridge Schools by 28 percent ($11,000), Whiting Schools by 20.5 percent ($10,300), Gary Schools by 19.3 percent ($10,200), Hammond Schools by 19.3 percent ($10,200), and Griffith Schools by 17.1 percent ($10,000).
Figure 2
School District Per Student Cost, 2003-2004

During the 2003-2004 school year, school districts statewide reported an average student/teacher ratio of 18.9 to 1. Led by the Crown Point Schools at 23.4 students per teacher, nine school districts in Lake County exceeded this average. Four had substantially fewer students for each teacher, however, including Gary at 17.3 to 1, East Chicago at 17.2 to 1, Lake Station at 17.1 to 1, and Whiting at 16.3 to 1. Furthermore, we found that student/teacher ratios differ little from district to district in the elementary schools. A much higher level of variability was found in the middle and high schools.
Overall costs alone cannot be used to assess educational efficiency. A broad range of performance measures, including ISTEP scores, should be considered, along with the demographics of the student body. Some students need more attention than others. Having said this, the data point to needed efficiencies in some school districts. Despite having low student/teacher ratios, overhead costs are high in the Gary, East Chicago, and Hammond school districts. In Gary, in particular, declines in enrollment—30.8 percent since 1988—do not appear to have been matched by reductions in overhead costs.
Police Departments
We excluded the costs of equipment and buildings and focused instead on key operating costs, such as personnel and supplies, in the budgets and appropriations for 2003. As expected, we found significant community-to-community differences. In 2003, the average cost for police services among the fourteen towns and cities we examined was $157 per resident. Three communities in Lake County exceeded this average by wide margins: Whiting by 115 percent ($337 per resident); East Chicago by 70 percent ($267 per resident), and Hammond by 25 percent ($196 per resident).
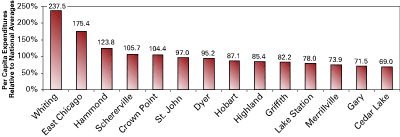
Police departments tend to become more expensive as communities grow in size. Overhead costs go up, and larger communities tend to face more severe public safety challenges than do smaller communities. For this reason, we compared expenditures incurred by municipalities in Lake County to national averages reported for towns and cities of different sizes (see Figure 3). Using these benchmarks, we found that five communities in Lake County exceeded the average levels of per capita spending associated with their peer communities: Whiting by 138 percent; East Chicago by 75 percent; Hammond by 24 percent; Schererville by 6 percent; and Crown Point by 4 percent. Other towns and cities in Lake County were below the average for their peers.
Figure 3
Per Capita Police Expenditures Adjusted for Size of Municipality, 2003
Click for larger image
Fire Departments
Unlike police departments, which tend to be organized similarly in most towns and cities, fire departments are structured differently in large and small communities. Lake County cities have professional fire departments, while volunteer fire departments serve towns and unincorporated areas. Cost structures vary dramatically as a result. For instance, fire protection and other services provided by the volunteer fire department in Schererville cost $16 per resident in 2003. In Hobart—by no means the most costly fire department in Lake County—the same set of services costs $114 per resident. The lion’s share of all expenditures in professional fire departments is devoted to personnel costs. Converting a professional fire department into a volunteer operation is not an option, however. Cities are required by law to employ professional firefighters. And even if public safety were not an issue, the cost of property insurance would skyrocket in cities lacking professional firefighting capacity.
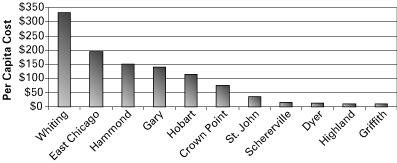
In 2003, the average cost for fire protection among the cities was $168 per resident (see Figure 4). Two cities in Lake County exceeded this average by more than 15 percent: Whiting by 98 percent ($331 per resident) and East Chicago by 16 percent ($195 per resident). Costs in Hammond, Gary, Hobart, and Crown Point were reported at $151, $141, $114, and $74 per resident, respectively.
Figure 4
Fire Department Operating Costs Per Capita, 2003

The Courts
The courts are a controversial component of Lake County’s budget for two reasons. First, Lake County’s judicial system consumes a great deal of revenue: $18.6 million in 2003. Approximately 90 percent of these funds were used to employ judges and support personnel. Another 7 percent was devoted to service contracts of various kinds. The remainder was allocated to supplies and capital expenditures. Second, the judiciary constitutes an independent branch of government, so the County Council approves budgets but has no direct power to impose fiscal discipline over the courts.
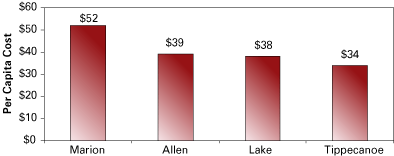
To assess efficiency in court administration, we gathered data pertaining to costs and caseloads. We compared Lake County data with data from Allen, Marion, and Tippecanoe counties. We found that costs per case in Lake County are not out of line (see Figure 5). Nevertheless, the high volume of cases that comes before Lake County courts contributes to high overall costs.
Figure 5
Per Capita Cost of Cases Disposed, 2003

Gauging Government Efficiency: Universal Lessons
Points of comparison are essential in assessing public sector performance. Typically, one, two, or three points of comparison are employed.
- Previous Performance: Three-year, five-year, and ten-year comparisons are often employed in indicators reports. Multiple data points facilitate the identification of patterns (e.g., long-term trends, cyclical swings, and temporary aberrations).
- Targets: A comparison against a target or goal can also be effective, particularly when used in combination with trend data. In fact, three benefits are associated with the use of targets or goals. They can prompt decision makers to envision more efficient or effective performance. The following kinds of questions can thus be posed: How much crime will the community tolerate? How much is it willing to pay for easier access to various services? To what extent should the community underwrite such “quality of life” services as parks and recreation programs? Answering these kinds of questions can lead to the development of a collective vision pertaining to public sector performance.
- Peer Comparisons: Community-to-community comparisons tend be more problematic than the trend and goal comparisons. Some communities resist the natural human tendency to ask “who’s better, who’s worse?” Others believe that comparisons of this kind can spur positive action. We concur with the latter position, but recognize that significant differences from community to community are not unusual. These difference or special circumstances need to be addressed when comparative data are used.
- Balance: Performance data must be effectively balanced. A small number of indicators are typically used to portray the overall efficiency and effectiveness with which a service is performed in the public sector. Such indicators, carefully selected, can suggest the need for additional information. They can also guide elected and appointed officials in setting priorities. And citizens can use this same select set of data to hold public officials accountable, a process that can involve praise and re-election as well as criticism.
Challenges in Measuring Efficiency of Spending
Five difficulties confront anyone attempting to develop a comprehensive set of performance measures pertaining to local government: (1) a lack of raw data (see sidebar); (2) the need to “balance” data in order to create a fair portrayal; (3) the selection of ratios appropriate to each function; (4) the temptation to ascribe inappropriate cause-and-effect relationships; and (5) the need to prompt action based on the data gathered. Each of these challenges must be addressed in any study of local government efficiency if there is any intention of ensuring effective government spending.


