
Demographics and Housing Information from the American Community Survey
Indiana Business Research Center, Kelley School of Business, Indiana University
Household and family types, income, occupation, travel to work, home values, mortgage burden, single-family versus apartment or mobile home. These are the characteristics of people and housing now available for Indiana on an annual basis from the American Community Survey. This article is a cursory overview of these statistics, based on the surveys from 2000 and 2002.
American Community Survey
A new era of annually released economic and demographic statistics for our states and metropolitan areas has quietly dawned. The American Community Survey (ACS), a new way of obtaining what was formerly collected just once every ten years from the long-form of the Census, is now available annually from the U.S. Census Bureau. With three years worth of data available for states and large metropolitan areas, the American Community Survey will begin full implementation across all counties of the United States in November 2004. Data for counties and cities with a population of 65,000 or more will be made available annually. Data for smaller areas will be available as three-year averages, largely because of the necessary sample size that needs to build up over a longer period of time.
A big issue with the current data available from the ACS is that it is a survey of households only. Thus, total population figures, age data, and education enrollment or attainment will not compare to other estimates of those groups, which will include people living in group quarters, such as college dormitories, prisons, halfway houses, and nursing homes.
Households
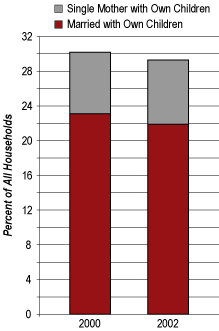
The majority of households in Indiana are formed by married couples. Nowadays, fewer than half of all married couple households have children under the age of eighteen. Of households with children under eighteen, the majority are married (22 percent) with an ever growing but still small number of single-mother households (7 percent).
Between 2000 and 2002, the number of Indiana households with children under eighteen has declined by 1 percent, reflective of the aging of our population (see Figure 1).
Figure 1
Hoosier Families with Children Declining
Born in Indiana
Nearly 5 million Hoosiers lived in the same house the year prior to the survey in 2002, while 132,000 people lived in a different state.
The percent of native Hoosiers living in households declined slightly (-0.5 percent) to 71 percent in 2002 compared to 2000 estimates. The proportion of the state’s household population born in another state grew slightly to 25 percent. Such minor but telling trends can also be seen in the slight up-tick in the percent of the household population born in another country, which grew from 3.3 percent (or 193,765 people) in 2000 to 3.4 percent (205,499 people) in 2002 (see Table 1).
Table 1
Birthplace of Indiana’s Foreign-Born Population
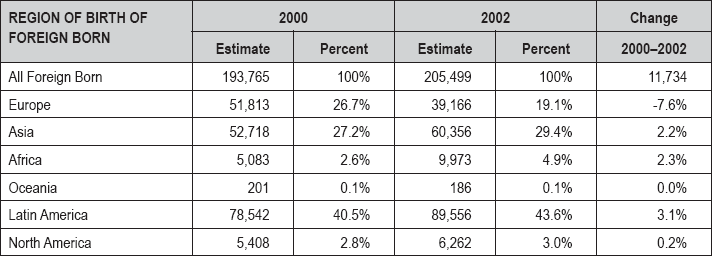
Click for larger image
English Spoken Here
The household population age five and older speaking only English at home declined by less than 1 percent between 2000 and 2002, to 5.08 million. The majority of those who spoke a language other than English at home in 2002 also indicated that they spoke English well or very well.
Close to 3.5 percent of persons age five and older spoke Spanish at home, compared to a national figure of 11 percent and 11.6 percent in Illinois. Indiana ranked twenty-eighth in the nation based on this measure, while New Mexico had the largest proportion of Spanish speakers, at 28 percent, followed closely by Texas (27.4 percent) and California (26.8 percent).
It’s Off to Work We Go—Usually Driving Alone in Our Cars or Trucks
The vast majority (83 percent) of working Hoosiers age sixteen and older drove to work alone in their cars or trucks in 2002, which is similar to previous years. Another 10 percent carpooled to work. The same proportion (3 percent) of people worked at home as the combination of those taking public transportation (1 percent) or walking to work (2 percent).
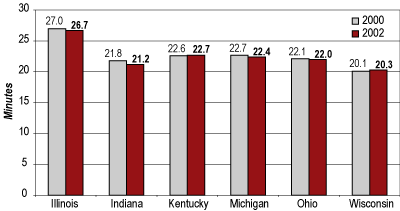
Among our neighboring states, Indiana has a relatively easy commute time (see Figure 2). In 2002, the average working Hoosier took 21.2 minutes to get to work—the shortest time next to Wisconsin’s 20.3 minutes. Illinois continues to experience the longest travel time at 26.7 minutes, thanks to congestion in and around Chicago, no doubt.
Figure 2
Travel Time to Work for Household Population Sixteen and Older
Once working Hoosiers get to the office or plant, they are most likely to be in management, professional, sales, or production occupations. Farming, forestry and fishing occupations are the smallest share of all types of jobs (1 percent).
The Average Indiana Home in 2002
- Single family unit with five rooms
- Worth $100,762 with a monthly mortgage of $928 (includes selected owner costs such as sewer, water, and taxes)
- Less than 30 percent of household income goes to monthly mortgage and owner costs
- Built prior to 1979 and heated by utility gas
- Two vehicles
Types of Homes
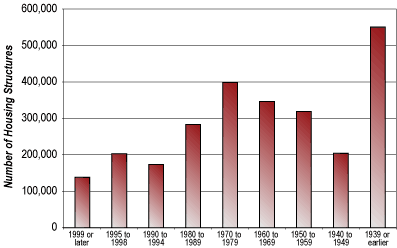
Most Hoosier housing units are single-family homes, estimated at slightly more than 70 percent in both 2000 and 2002. Mobile homes account for 7 percent of all housing units in Indiana, while 4.7 percent are in apartment buildings with five to nine units. The vast majority of homes were built prior to 1979, with 21 percent built before 1939 (see Figure 3).
Figure 3
Indiana Housing Structures by Year Built, 2002
Home Values and Mortgages
In keeping with the national trend of appreciation, Indiana’s median home value grew to $100,762 (see Table 2), a 2 percent increase from the 2000 estimate.
Table 2
The Homes of Our Neighbors: The Midwestern States, 2002
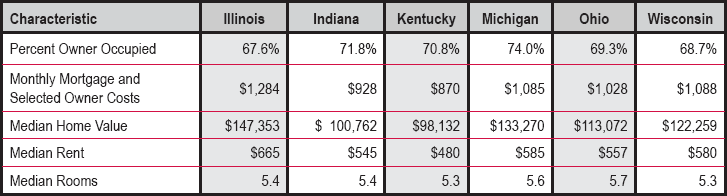
Click for larger image
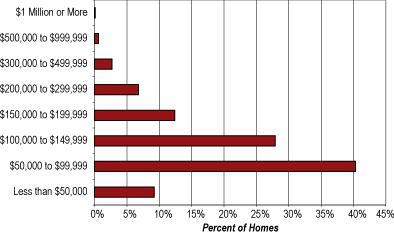
At the same time, the median monthly mortgage payment grew from $892 in 2000 to $928 in 2002. The majority (68 percent) of Indiana’s homeowners’ dwellings were valued between $50,000 and $149,000 (see Figure 4).
Figure 4
Home Values in Indiana, 2002
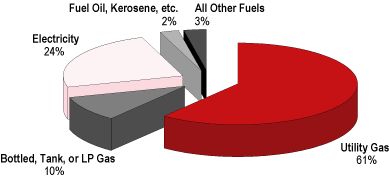
Home Heating Fuel
Utility gas remains the dominant heating fuel for Indiana’s homes, with 1.4 million homes using this heating source (61 percent). Electricity (24 percent), bottled, tank or LP gas (10 percent), and fuel oil or kerosene (2.4 percent) are the next choices for heating fuel, as seen in Figure 5. The use of solar energy as a source of home heating is the choice of a mere 1,167 homes, a figure that is less than it was according to the estimates for 2000. Wood burning as a source of heat actually increased from an estimated 33,000 homes in 2000 to more than 43,000 in 2002. However, the ACS considers the margin of error on this change to be statistically significant; thus, the increase may be explained by sample error.
Figure 5
Indiana’s Home Heating Fuel Choices, 2002
Vehicles Available to Households
The majority of households (61 percent) have two or more vehicles available for use. Nearly 7 percent (or 161,000 Indiana households) do not have a vehicle, while 21 percent have three or more vehicles. Further exploration of the data through the ACS public use microdata sample would allow us to determine if those households have access to public transportation (in the case of no vehicle households) or teenagers (in the case of three or more car households).
Telephone Availability
Between 2000 and 2002, the number of occupied housing units with no telephone service increased. This is a reversal of a decades-long decrease in the number of homes without telephones.
Is this a harbinger of cell phones replacing hard-wired telephones? Possibly. The phrasing of the question could lead respondents to check off “no telephone service” on the questionnaire. According to documentation on the ACS, “the question asked whether telephone service was available in the house, apartment, or mobile home. A telephone must be in working order and service available in the house, apartment, or mobile home that allows the respondent to both make and receive calls. Households whose service has been discontinued for nonpayment or other reasons are not counted as having telephone service available.”
What Hoosier Housing Is Not—Overcrowded and Unplumbed
Less than 1 percent of Indiana’s homes lack either complete plumbing or complete kitchen facilities. And slightly less than 2 percent of Indiana dwellings are overcrowded—by definition, that’s more than one person per room (not counting kitchens and bathrooms).
More results from the new American Community Survey will be published in these pages, with greater geographic detail as time goes by. In the meantime, the Internet (www.census.gov/acs/www/) is an excellent resource for obtaining ACS data and even more importantly, learning about the issues of use as compared to the traditional decennial census.
