Double-Edged Sword: Personal Income As a Measure of Indiana's Wellbeing
Indiana Business Research Center, Kelley School of Business, Indiana University
Per capita personal income (PCPI) is a frequently used measure of economic well-being. (1) It is a number that Hoosier politicians should prefer to ignore.
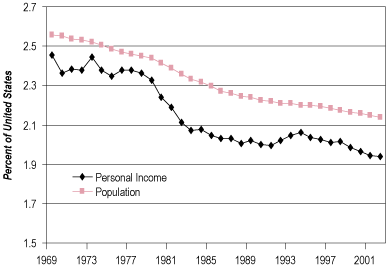
PCPI is the result of dividing personal income (the sum of all receipts by Hoosiers as a result of working, owning capital, or receiving certain government transfers such as social security or unemployment compensation) by the total population. Figure 1 shows the history of those two data series from 1969 to 2002 (the latest year for which we have data). In both population and personal income, Indiana’s share of the United States is in long-term, virtually continuous decline. This happened during Republican administrations from 1969 to 1989 and Democratic administrations since then.
Figure 1
Indiana’s Share of the Nation, 1969 to 2002

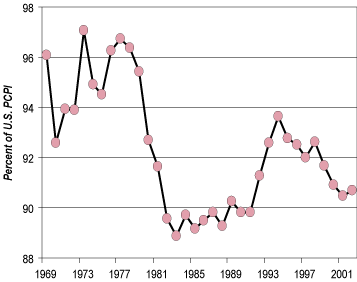
The path of decline is not uniform. There have been some brief periods when Indiana’s share of the nation’s personal income has risen before falling again. Thus, we see a somewhat erratic path for PCPI in Figure 2.
Figure 2
Indiana’s PCPI As a Percent of the Nation, 1969 to 2002

Recent Experience
As with any number that has a numerator and a denominator, it can be tricky to interpret. For example, the state with the worst percent change in PCPI between 1997 and 2002 was (surprise!) Nevada. The land of desert and dice was the fastest growing state in population (22.9 percent) and second fastest in personal income (39.8 percent). But when the numbers are put together, Nevada has a 13.8 percent increase in PCPI, the worst performance of the fifty states.
The best performance in PCPI came in states with slow population growth or even population decline. Wyoming’s personal income growth rate ranked fifth in the United States, but its population growth rate was forty-fourth. This combination led to Wyoming leading the nation with a 32.5 percent increase in PCPI. North Dakota came in second in PCPI growth—despite a below average personal income growth rate of 26.7 percent (ranked thirtieth)—because its population declined 2.4 percent (fiftieth in the nation). Colorado managed both a high ranking in personal income growth (first) and in population (third), enabling the state to rank eighth in PCPI.
Indiana, over this recent five-year period, ranked thirty-seventh in PCPI growth at 20.3 percent. The United States grew 22 percent. Our personal income growth rate was 24.4 percent (thirty-ninth) compared to the U.S. rate of 28.8 percent. Our population growth rate was 3.4 percent (twenty-eighth) while the nation grew 5.6 percent.
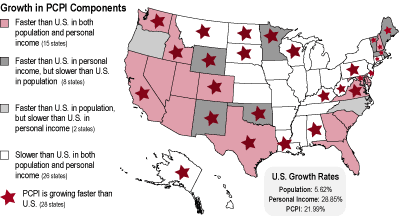
The differences among the states can be seen in Figure 3. All eight states that experienced faster growth than the nation in personal income but slower population growth enjoyed a faster increase in PCPI than did the nation. Fifteen states grew faster than the United States in both personal income and population, and only half of them saw a rise in their PCPI as a result. Indiana was among the twenty-six states that lagged the nation in both personal income and population growth rates. Within that group, it was among the twelve experiencing a slower rate of PCPI growth.
Figure 3
Change in PCPI Components Relative to the Nation, 1997 to 2002
Click for larger image
In short, fast population growth reduces the growth rate of PCPI. If PCPI is a target of policy, emphasis should be on personal income growth rather than adding to the number of inhabitants.
Indiana Counties
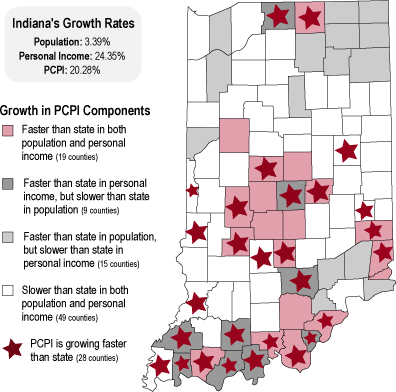
How have Indiana counties fared over the past five years? Figure 4 shows the prevailing patterns in the state. Hamilton and Hendricks counties, which led the state in growth rates for both personal income and population, were sixty-fourth and forty-ninth in PCPI growth, respectively. By contrast, Crawford and Owen counties were among the top growing counties in personal income, population, and PCPI advances. Of the twenty counties losing population in the five-year period, only Perry County managed to raise its PCPI faster than the state. Hence, population loss is often an indicator of a weakening economy whereas slow population growth can aid an economic advance in PCPI.
Figure 4
Change in PCPI Components Relative to the State, 1997 to 2002


