Exodus to Suburbia Continues, but a Little Slower
Indiana Business Research Center, Kelley School of Business, Indiana University
The strong population growth in the counties surrounding Marion County continues. This is corroborated by the Census Bureau’s recent county-level population estimates for 2003. If we look at growth from the April 1, 2000 census to the July 1, 2003 estimates, the five fastest-growing counties in Indiana surround Marion County (see Figure 1).
Figure 1
Population Change, April 2000 to July 2003
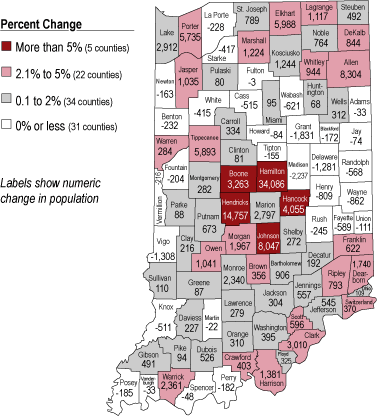
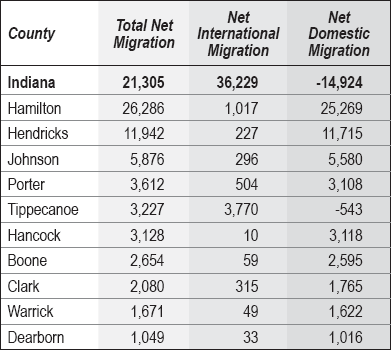
As evidence of urban flight, those five counties are also among the top seven in total net in-migration (see Figure 2 and Table 1), while Marion County has the highest total net out-migration at 18,989. Hamilton County leads the pack with a total net in-migration of 26,286 over the three-and-one-quarter year period.
Figure 2
Total Migration, April 2000 to July 2003
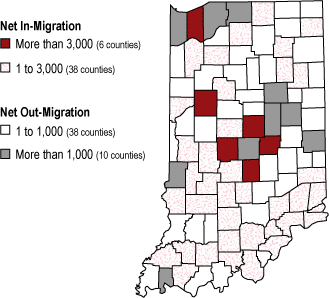
Table 1
Top Ten Counties by Total Migration, April 2000 to July 2003
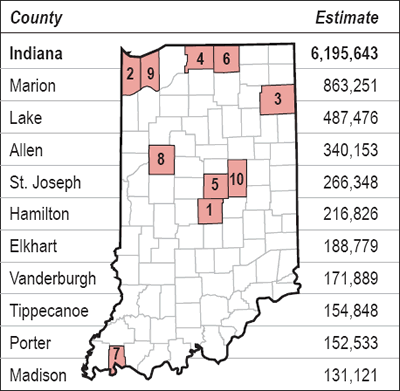
Although Marion County (Indianapolis) takes the greatest loss from out-migration, it achieves a total population increase of 2,797 after taking births and deaths in consideration. It is the only county in Indiana with an estimate greater than 500,000, weighing in at 863,251. Lake County (Gary) is approaching the half-million threshold, and has the second highest estimate at 487,476. Ranked third is Allen County (Ft. Wayne), coming in at 340,153. Rounding out the top five are St. Joseph County at 266,348, and Hamilton County at 216,826. Contributing to the explosive growth of Hamilton County is the town of Fishers, which conducted a special census that yielded a count of 52,390 as of November 2003. This compares to a count of 37,835 in April 2000.
One notable fact about the ten largest counties (see Table 2) is that their summed population estimates comprise nearly half (about forty-eight percent) of the state’s estimated population. This group of counties tips the scale at 2,973,224, while the estimate for the whole state of Indiana is 6,195,643.
Table 2
Ten Largest Counties, 2003
A “Hiccup” in Suburban Growth?
Although the suburban growth in areas surrounding Marion County remains strong, it has slowed down recently. Let’s take another look at the top five growth counties, but this time focus on year-over-year changes in the estimates (see Figure 3).
Figure 3
Five Fastest Growing Counties
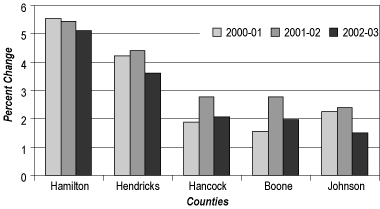
All five of these counties have experienced a slight drop-off in percent growth, whereas the state of Indiana as a whole has experienced a slight increase. With the exception of Hamilton County, the greatest growth for these counties occurred during the 2001–02 period. This is interesting in light of the 2001 recession, which did not end until November of that year.
What can we make of the drop-off? Maybe it is a lagged effect from the recession. Thanks in part to Indiana’s relatively large reliance on the manufacturing sector for employment, we have had a harder time recovering from the 2001 recession than many other states. The so-called jobless recovery seems to have had an impact on some people’s willingness and/or ability to become residents of one of the “doughnut” counties. Perhaps these counties are also reaching some limits as they struggle to create the additional infrastructure necessary for accommodating the ongoing influx. In short, it can be challenging to keep up with the growth.
Flight to the Suburbs Elsewhere in Indiana
So as not to ignore the suburban growth taking place in other areas of the state, let’s have another look at Table 1. Of the five counties in the list that we haven’t already discussed, four are near large urban areas. The exception, Tippecanoe County, makes the list due to its high international migration, courtesy of Purdue University.
Porter County, ranked fourth in migration, is directly to the east of Lake County and not far from Chicago. Lake County’s total net out-migration is 3,574, and is only surpassed by Marion County’s. Also note that the two counties to the east of Porter County, namely La Porte County and St. Joseph County, have incurred out-migration losses as well. Among Indiana’s ninety-two counties, they are ranked eighty-fifth and ninetieth in total migration, respectively.
Clark County, just across the river from Louisville, ranked eighth in migration. Next is Warrick County, a county that seems to attract migrants from neighboring Vanderburgh County (ranked eighty-fourth in total migration), as well as nearby Henderson County, Kentucky. At number ten, we have Dearborn County, which is across the state line from Cincinnati. Just one shy of making the top ten is Morgan County, which is on the southwest corner of the ring of counties surrounding Marion County. Number twelve is Harrison County, also near Louisville.
The Big Picture
When Indiana’s ninety-two counties are compared among all U.S. counties, we make a few showings in the Census Bureau’s top one hundred lists. Marion County is ranked number fifty-two in estimated population for July of 2003, which is down from a rank of fifty for April 2000. In terms of percent change since Census 2000, two Indiana counties make the top one hundred. Hamilton County thunders ahead at number twenty-one with 18.7 percent growth, and Hendricks County ranks sixty-second, registering a 14.2 percent increase. Therefore, when it comes to suburbanization, the Hoosier state certainly brings something to the table.


