Study Explores Economic Impact of Indiana Nonprofits
School of Public and Environmental Affairs, Indiana University
School of Public and Environmental Affairs, Indiana University
Nonprofit organizations contribute to the quality of life for all Indiana citizens. What is not widely appreciated, however, is that the private nonprofit sector is a major economic force in the state of Indiana.
A report released by the Center on Philanthropy and the School of Public and Environmental Affairs at Indiana University, in cooperation with the John Hopkins Nonprofit Employment Data Project, presents new information on the size, composition, and distribution of paid employment in Indiana’s private nonprofit sector. It is part of a larger project, Indiana Nonprofits: Scope and Community Dimensions, currently underway at Indiana University.
Nonprofits included in this study are registered as tax-exempt entities with the U.S. Internal Revenue Service under Section 501(c) of the Internal Revenue Code. This includes private, not-for-profit hospitals, clinics, colleges, universities, elementary schools, social service agencies, day care centers, orchestras, museums, theaters, homeless shelters, and soup kitchens. It also includes a wide variety of civic organizations, trade associations, unions, and other membership groups.
The sector’s role in the Indiana economy is underestimated because some nonprofits (such as religious congregations) are not required to participate in the ES-202 reporting systems. Others cannot be identified as nonprofits because they are not required to register with the IRS (such as congregations) or do not do so for a variety of reasons.
Employment
Nonprofit organizations employed a minimum of 222,000 paid workers in Indiana in 2001, including 194,000 that worked for registered charities. This means that 7.7 percent of Indiana employees worked for a nonprofit organization, or about 1 out of every 13 workers.
Over half of all Indiana nonprofit establishments are charities (thereby eligible to receive tax-deductible contributions under Section 501(c)(3) of the Internal Revenue Code). They employ about 88 percent of all nonprofit employees, suggesting that on average they are significantly larger than nonprofits registered under other subsections of the IRS codes, such as general social welfare or mutual-benefit nonprofits.
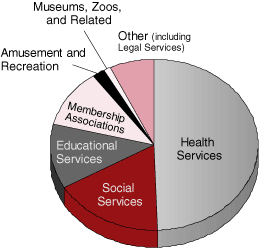
The health services sector accounts for 49 percent of all nonprofit employment in Indiana (see Figure 1). This includes jobs in hospitals, nursing and personal care facilities, clinics, and home health care services. Social services account for an additional 17 percent, including employment in individual and family services, job training and related services, child day care services, and residential care.
Figure 1
Indiana's Nonprofit Employment by Field, 2001

The distribution of nonprofit charitable employment in Indiana is similar to the national average, although Indiana has slightly larger shares of charitable employment in health and social services, but lower shares in education, membership associations, and culture and recreation. Nonprofit hospitals account for almost 88 percent of all private hospital employment in Indiana, compared to only 66 percent nationally.
Payroll
The 222,000 nonprofit employees in Indiana earned an estimated $6 billion in wages in 2001, with $5.4 billion earned by those working for charities. Overall, nonprofit employees accounted for 6.6 percent of the state’s total payroll of $92.3 billion.
The nonprofit payroll exceeded the payrolls for several sectors, including finance, insurance, and real estate ($5.8 billion), construction ($5.4 billion), and state and federal government combined ($4.6 billion). Nonprofit payrolls, however, were less than the payrolls for local government ($7.6 billion), nondurable manufacturing ($7.5 billion), retail trade ($9 billion), and durable manufacturing ($19.6 billion).
Wages
The average weekly wage for nonprofit employees in Indiana is 19 percent lower than that of for-profit workers and 18 percent lower than that for government workers. However, when focusing on industries where nonprofits are concentrated, such as social services and health, nonprofits offer higher wages than for-profit providers in some service fields, although both are generally lower than average weekly wages paid to government employees.
The data do not allow us to determine whether the differences in earnings of nonprofit, for-profit, and government employees reflect real differences in wage levels or different rates of using part-time workers.
Regional Distribution
Like Indiana’s population, most of the state’s nonprofit employment is located in the state’s metropolitan regions, accounting for 80 percent of all nonprofit employment in the state (Editor’s note: the regions used in this study do not have the same county configurations as the federally-defined metropolitan statistical areas). Moreover, the nine-county Indianapolis metropolitan area had more than 65,000 nonprofit employees, or almost 30 percent of the total Indiana nonprofit employment in 2001.
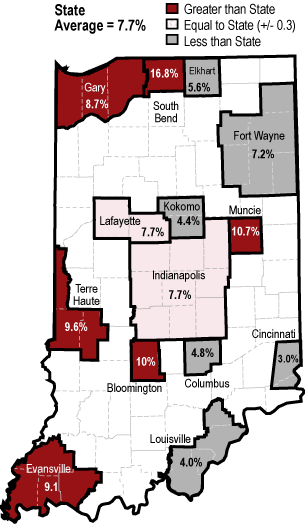
The nonprofit share of total regional employment varies considerably across the state’s metropolitan areas (see Figure 2). The nonprofit sector is particularly important in the South Bend region, accounting for almost 17 percent of total county employment in 2001, or about one in six employees. This most likely reflects the presence of large nonprofit health and educational institutions in that community.
Figure 2
Nonprofit Share of Total Employment in Selected Regions

Nonprofit employment accounts for just over 6 percent of total employment in the non-metropolitan areas of the state; however, nonprofit employment exceeds 12 percent of total county employment in Grant, Jefferson, Montgomery, and Putnam counties.
At $600, the average weekly wages for nonprofit workers were highest in the South Bend region. Nonprofit wages were notably below the statewide average of $521 for the Bloomington ($457) and Fort Wayne ($453) areas and were significantly below the statewide average in the Lafayette ($431) and Kokomo ($408) regions.
Growth
Between 1995 and 2001, employment in the Indiana nonprofit sector increased by 37,000, or 20 percent. This growth in nonprofit employment more than offset the loss of 33,000 jobs in the durable manufacturing industry.
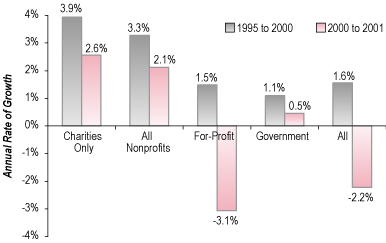
Between 1995 and 2000, nonprofit employment grew at a rapid rate of 3.3 percent per year, slowing to 2.1 percent between 2000 and 2001 (see Figure 3).
Figure 3
Average Annual Rates of Growth in Indiana Employment by Sector

As a result of the comparatively high rate of growth in nonprofit employment, the nonprofit share of total Indiana employment grew from 6.8 percent in 1995 to 7.7 percent in 2001.
Health services accounted for almost half (49 percent) of the overall growth in Indiana. Social services accounted for 23 percent, while educational services absorbed another 16 percent of the growth in employment.
The number of nonprofit employees in legal services actually declined by 29 percent over the 1995 to 2001 period, while for-profit employment increased in that field by 16 percent.
Among the state’s regions, the highest rate of average annual growth in nonprofit employment over the 1995 to 2000 period occurred in Bloomington (6.8 percent), at more than twice the statewide rate. However, nonprofit employment declined 0.4 percent in Bloomington, while it continued to increase statewide between 2000 and 2001.
The Gary, Evansville, Lafayette, and Kokomo regions had below average rates of growth in nonprofit employment for both periods, with nonprofit employment in Kokomo actually declining 2.1 percent between 2000 and 2001.
Not adjusting for inflation, total payroll for nonprofit employees increased by 48 percent, from $4.1 billion in 1995 to $6 billion in 2001. This was faster than both for-profits and government organizations.
As a result of these differential growth rates, the nonprofit share of total payroll in Indiana increased from 5.8 percent to 6.6 percent. This increase was less than the growth in the sector’s share of total employment, suggesting that the average weekly wages of nonprofit employees—which increased by $99—grew more slowly than those of workers in the for-profit and government sectors.
The economic role of the nonprofit sector is not well understood by policymakers, the press, or the public at large. As a result, this sector is often overlooked in economic development and education and training efforts that could prove extremely beneficial to it in the long term. Hopefully, with a greater knowledge of the nonprofit sector’s economic impact, Indiana citizens will understand the immense stake they have in its continued health.


