The Hoosier Melting Pot Continues to Simmer
Indiana Business Research Center, Kelley School of Business, Indiana University
Indiana’s population has grown slowly and unevenly in the first two years of the new millennium, according to the latest official population estimates from the U.S. Census Bureau.
The Census Bureau produces these estimates as of July 1 of each year, based on data on births, deaths, and migration. These estimates are used to allocate federal funding, monitor recent demographic changes, and compute various economic and social indicators.
Continuing a decades-long trend of slow growth, the state’s population expanded by 67,118 from 2000 to 2002, a much slower rate (1.1 percent) over the two years than that seen by the nation as a whole (2.2 percent).
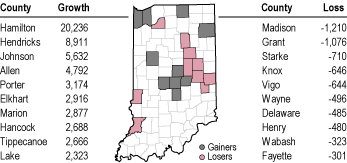
Some parts of Indiana witnessed strong growth during this period, while the population in others declined. Fifty-nine of the state’s ninety-two counties experienced population increases, led by Hamilton County, whose estimated 20,236 new residents accounted for 30 percent of all population growth in Indiana; this represents an increase in Hamilton County’s population of 10.9 percent in just two years. Table 1 highlights the ten largest-growth and ten largest-decline counties in the state over the two-year period.
Table 1
Indiana's Top Ten Counties for Population Growth and Loss,
2000 to 2002

Race
Breaking out the population change figures by race and Hispanic origin adds interesting depth to the data. As has long been the case, Indiana is a predominantly white state, with 89 percent of the population in 2002 identifying themselves as white alone; this is well above the national average of 80.7 percent. In fact, fifty-one counties are more than 98 percent white—that is 55 percent of all Indiana’s counties. Moreover, thirteen counties have a population that’s more than 99 percent white.
At the state level, the next largest racial group is blacks or African Americans, constituting 8.5 percent of the total population. As seen in Table 2, the other racial groups each comprise approximately 1 percent or less of the Indiana population.
Non-white Hoosiers live in the greatest concentrations in Indiana’s largest counties, led by Marion (28.5 percent) and Lake (27.9 percent) counties. Interestingly, only three other counties (St. Joseph, Allen, and La Porte) have a percentage of non-white residents above the state average of 11 percent, reflecting the influence those high-population counties have on state averages.
Table 2
Percent of Total Population by Race and Hispanic Origin, 2002

Continued Hispanic Growth
Also shown in Table 2 is the proportion of Hoosiers of Hispanic origin, who accounted for 3.8 percent of the Indiana population in 2002. Hispanic origin refers to family heritage rather than race and is not considered a racial category. Thus, Hispanic residents are found within all of the racial groups.
The percentage of Hispanic residents is above the state average in thirteen counties, primarily found in northern Indiana. Of these, seven are relatively industrialized counties (whose large populations skew the averages).
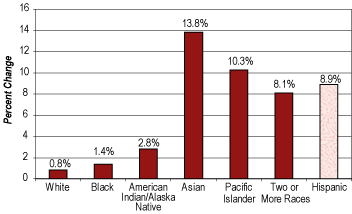
Another interesting way to view the new population estimates data is in terms of relative growth rates of the various racial and ethnic groups. As Figure 1 reveals, Indiana’s largest racial groups are growing at a much slower rate than several of the smaller groups, although the low numbers of American Indians and Alaska Natives in the state are not growing much faster than the populations of whites or blacks.
Figure 1
Indiana's Population Growth by Race and Hispanic Origin, 2000 to 2002

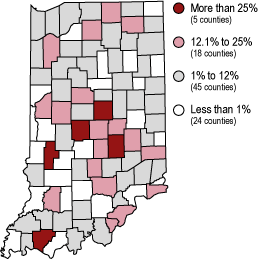
On the other hand, the number of Hispanic Hoosiers is both sizable and growing rapidly. This group is the state’s second largest minority group, almost half the size of Indiana’s black population. The 19,277 Hispanic residents added from 2000 to 2002 represented 28.7 percent of the state’s total population growth during that period (see Figure 2).
Figure 2
Percent Change in Hispanic Population, 2000 to 2002

Varied Population Change
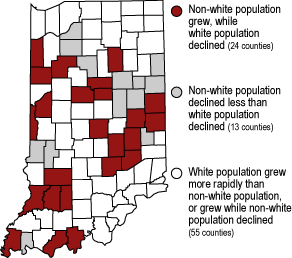
The nature of population change in different racial and ethnic groups varies widely across Indiana’s counties, as shown in Figure 3. For instance, contained in Marion County’s net population increase of 2,877 is a decrease of 5,121 white residents, coupled with a large increase in the numbers of blacks and other groups. Likewise, the number of Marion County Hispanics increased by more than 5,000 over the two-year period, while there were 2,293 fewer non-Hispanics in the county. Similar and contrasting patterns of population change across other counties undoubtedly reflect a variety of underlying factors driving population change in Indiana.
Figure 3
Change in Share of Population by Race, 2000 to 2002


