Dissecting Indiana's Decline in Personal Income
Executive Director, Indiana Business Research Center, Kelley School of Business, Indiana University
The fact that Indiana's share of the U.S. personal income and population has been declining is not news any longer. Even the fact that Indiana's per capita personal income (PCPI), relative to the nation's PCPI, is also in decline has become widely understood.
But, to date, pinpointing the components of that relative decline has not been undertaken. Hop on for a ride through the data. As you fasten your seat belts, remember that we are discussing relative decline. Indiana and the nation have both been making progress. Our search is for the components of personal income and sectors of the economy where Indiana has had its strongest and weakest performance compared to the nation as a whole.
If, however, such a journey seems too laborious, we recommend you flip to the summary and see all revealed in one simple table (see Table 2).
Personal Income, Population, and PCPI
In 1969, Indiana enjoyed 2.47 percent of the nation's personal income. At the time we had 2.55 percent of the U.S. population. By the year 2000, our share of personal income had fallen 1.97 percent and our population was but 2.16 percent of the nation (see Figure 1).
Figure 1
Indiana's Share of U.S., 1969-2000
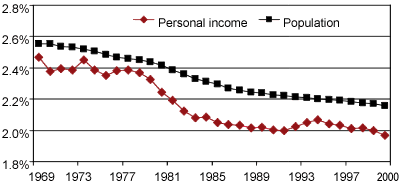
A declining share of the nation's income or population is not a sign of being worse off in absolute terms. During this period Indiana grew in both measures, only at a rate that was slower than the rest of the nation. Thus, the state was in a condition of relative decline.
Personal income divided by population yields per capita personal income (PCPI). When a state's share of the nation's income is less than its share of the nation's population, then its PCPI will be less than the nation's PCPI. Thus in 1969, Indiana's PCPI was $3,714 while the nation's was at $3,846. Setting the U.S. equal to 100, Indiana's relative PCPI index value was at 96.57 or 3.43 percent below the nation's. By 2000, Indiana's PCPI index was 91.13 or 8.87 percent below the U.S. (see Figure 2).
Figure 2
Five Distinct Periods: Indiana's Per Capita Personal Income as a Percent of
U.S.
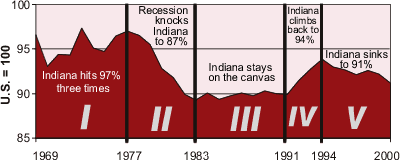
If Indiana had started above the national average in PCPI, we could claim that this was just a case of the rest of the nation catching up with us. That was not a luxury we enjoyed.
As seen in Figure 2, there were five different periods over the span of years from 1969 to 2000. During the first period, 1969 to 1977, Indiana hit 97 percent of the nation three times, slipping down during recessions and fighting back to the 97 percent level. But the next recession knocked Indiana down to 89 percent of the U.S. in 1982. During the third period, Indiana stayed on the canvas through 1991. Then, in the fourth period, Indiana climbed back to 94 percent of the nation, but the recovery was short-lived. By 2000, the Hoosier state was again in a sinking mode, falling to 91 percent.
Figure 1 showed us that the changes in population are fairly regular but that the movements of personal income are what direct the variations of PCPI seen in Figure 2. A closer look at personal income and its components is warranted.
Components of PI
Like Gaul, personal income is divided into three parts:
- Earned income—what we make working for ourselves or others
- Dividends, interest, and rent—the returns on capital we own
- Transfer payments, government payments for unemployment and social security
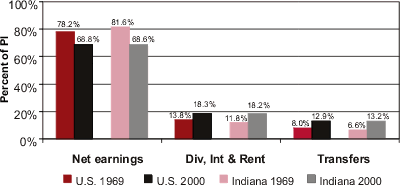
In 1969, earnings were a larger component of personal income in Indiana (81.6 percent) than in the nation (78.2 percent) (see Figure 3). By 2000, Indiana and the nation were close in earnings, dividends, interest, and rent as well as in transfer payments.
Figure 3
Components of Personal Income, 1969 and 2000
In both dividends, interest and rent (DIR) and transfer payments Indiana tended toward the national average per capita while slipping in earnings per capita1 (see Figure 4). The result was an upward movement in Indiana's PCPI relative to the nation.
Figure 4
Indiana's Per Capita Personal Income Components as a Percent of U.S.
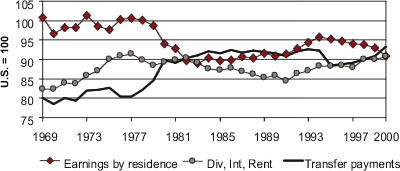
But together these two components still only accounted for 30 percent of total personal income. Hence what happened to earned income dominated the movement of PCPI. Between 1969 and 2000, Indiana's earnings per capita fell from 100.73 percent of the national level to 90.85 percent. This decline overwhelmed the positive effects of upward movements in the other two components.
What Happened to Earnings?
The slide of earnings in Indiana has several components to consider; to understand
this decline we must look at the starting point and go through the steps until
we get to the earnings component of personal income.
The earnings we have been discussing are known as Net earnings by place of
residence. They are computed this way:
Earnings by place of work
Less Contributions for social insurance
Plus Residence adjustment
Equals Net earnings by place of residence
Earnings by place of work is the total payroll, contributions by employers to pensions and health plans, bonuses, and other payments for labor where the firm is located. They may be examined as the product of number of workers and the average wage (compensation) per worker.
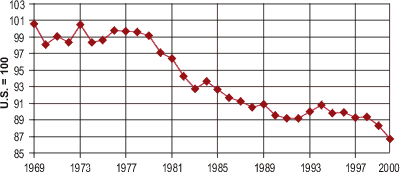
Between 1969 and 2000 the average wage per worker in Indiana relative to the nation fell from parity (100.6) down to 86.7 (see Figure 5). The decline in earnings per job is probably the most important single factor in the decline of per capita personal income.
Figure 5
Earnings Per Job—All Jobs:
Indiana Relative to the U.S.
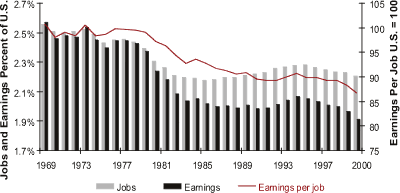
With Hoosier earnings per job not keeping pace with earnings across the nation, Indiana became less attractive as a place to work. This might have been offset by more firms willing to move to Indiana to take advantage of its low paid workforce. But that was not the case. Indiana's share of total U.S. employment fell from 2.56 percent to 2.2 percent, although it seems to have stabilized since 1981 (see Figure 6).
Figure 6
Indiana's Share of U.S. Employment

Put these two negative factors together and the decline in relative earnings becomes clear. Indiana's share of total earnings in the U.S. fell from 2.6 percent to 1.9 percent between 1969 and 2000 (see Figure 7). Although most of that fall occurred in the late '70s and early '80s, there would seem to be no suggestion of an upward movement despite the employment bump of the early '90s. The inexorable decline in relative earnings per job (Figure 5) has offset any employment gains that have been made.
Figure 7
All Jobs—Indiana Compared to the U.S.
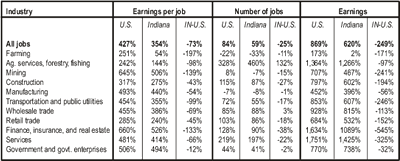
The decline of Hoosier earnings per job relative to those in the nation was widespread across industry groups (see Column 3, Table 1). At the same time, employment in Indiana failed to keep pace with the nation in all sectors other than Agricultural Services and Wholesale Trade (see Column 6, Table 1). Together these deficiencies yielded shortfalls in total earnings, relative to the nation in each sector of the Indiana economy (see Column 9, Table 1). Hardest hit was Finance, Insurance and Real Estate. Manufacturing, despite popular hand-wringing, did not fare poorly in comparison.
Table 1
Percent Change in Earnings Per Job and Number of Jobs from
1969 to 2000
Click for Larger Image
The Remaining Components of Earnings
If you have been struggling through this article, the hard work is now over, and that clear summary, promised earlier, will emerge soon.
Now that we have seen the dramatic relative decline of earnings by place of work in Indiana, we can proceed to the components that get us to earnings by place of residence.
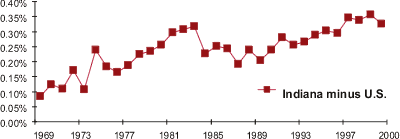
Contributions for social insurance are the payments made for social security, Medicare, and unemployment compensation by the employer or the employee. They are deducted from earnings by place of work. We would expect that these deductions would be the same percent of income for all states. But that is not the case (see Figure 8).
Figure 8
Contributions for Social Insurance as a Percent of Earnings by Place of Work
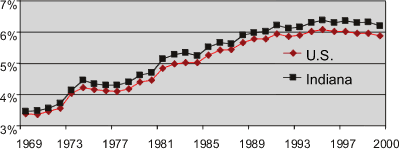
Contributions for social insurance in both Indiana and the U.S. are rising as a percent of total earnings by place of work. But Indiana has a higher rate and the differential between Indiana and the U.S. has also been rising (see Figure 9). This rising differential, although small, decreases our per capita personal income relative to the nation.
Figure 9
Differential Between Indiana and the U.S. in Contributions for Social Insurance
as a Percent of Total Earnings by Place of Work
Why is there a differential between the Indiana and the U.S. and why is it rising? There are no known answers, but we can make some good guesses.
First, social security taxes are capped at a given income figure each year. Currently that number is around $84,000. If a Hoosier earns $80,000, all of that income is taxed for social security. If a Buckeye earns $100,000, then only the income up to $84,000 is taxed and the remaining $16,000 is not taxed for social security. If Indiana has a smaller percentage of persons earning over $84,000 than does Ohio, our percent of earnings for social contributions will be higher than that percentage for Ohio because more income in Ohio escapes social security taxes. Persons making high incomes, including big bonuses, often have a large portion of their earnings not taxed for social security purposes. Indiana may have a smaller portion of its work force earning these big bucks.
Second, not all persons are subject to social security taxes. In some states, employees of state and local governments have been exempted from social security taxes. This is not common in Indiana and could be another factor increasing the percent of earnings going to social contributions.
Another adjustment to earnings by place of work is one made for commuting behaviors. Many people work in one county and live in another. Sometimes these counties are in different states.
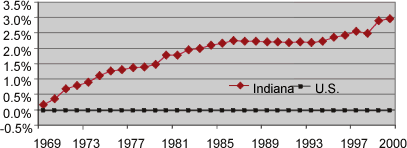
On balance, Indiana is a net gainer from commuting. Our workers bring in more money than leaves the state as a result of the daily traffic crossing the Illinois, Michigan, Ohio, and Kentucky borders of Indiana. In addition, our gains from commuting have been rising over time, while the nation as a whole has shown virtually no change in this factor (see Figure 10). Residence adjustment also tends to increase Indiana's PCPI relative to the nation.
Figure 10
Residence Adjustment as a Percent of Net Earnings by Place of Residence
Summary
How do all these factors come together to yield a decline in Indiana's PCPI relative to the nation? Table 2 tells all. Where Indiana's percent change in a component (on a per capita basis) did not keep pace with the nation, our relative position slipped. The change in dollar amounts may have a different sign from the percent change because, although we may be growing faster than the nation, we remain behind it in level of income. For example, if a Hoosier has an income of $1,000 and it doubles to $2,000, she will still be behind a Buckeye who started with $10,000 and only saw her income increase by just 30 percent. The Hoosier will have a change of $1,000 while the Buckeye will enjoy change of $3,000.
Table 2
Changes in Per Capita Personal Income, 1960-2000
Click for Larger Image
Compensation for workers in the Hoosier state has not risen as fast as elsewhere. No other factor has greater impact on PCPI.
Indiana made some gains from the residence adjustment, largely because workers in Chicago, Cincinnati, and Louisville choose Hoosier homesites. At the same time, Indiana lost ground (relatively) in contributions for social insurance, probably because of our relatively low total income levels per worker.
Indiana also outpaced the nation in transfer payments and returns on capital (dividends, interest and rent). These may be demographically driven factors as the Hoosier state aged more rapidly in the latter part of the 20th century than did the U.S. as a whole.
The bottom line: if we are concerned about per capita personal income, we should focus on earnings per worker and more workers in higher paying jobs. If that comes as a surprise to anyone, he or she has been asleep for past twenty years.
Endnotes
- Although below the national figure in each component of personal income per capita, the state has shown an upward trend in two elements that may be related to a population growing older faster than the nation as a whole. As the population ages, social security payments become more important and citizens tend to be owners of financial and real assets that earn dividends, interest, and rent. During the period under study, Indiana went from being a state with a younger population to one with a population older than the national average.
- Source: Base data taken from the U.S. Bureau of Economic Analysis.


