Indianapolis
Indiana Business Research Center, Kelley School of Business, Indiana University, Bloomington, Indianapolis, and Gary
To write of Indiana is to ignore the three divisions within the state that are of importance. For example, between October 1999 and the same month in 2002, the state lost 81,700 jobs. But none of these jobs were lost in the Indianapolis Metropolitan Statistical Area (MSA). Data from the Bureau of Labor Statistics and the Indiana Department of Workforce Development show that 65 percent (52,900) of that job loss occurred in the other metro areas of Indiana (see Figure 1).
Figure 1
The Three States of Indiana
The Indianapolis Metra Area, Other Metro Areas, and Non-Metro Areas
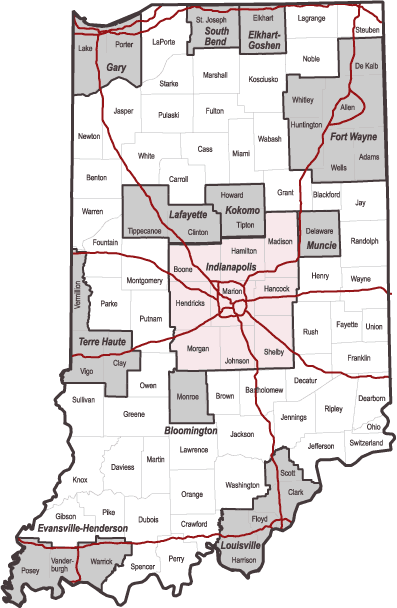
The combination of Indiana's counties that are not part of an MSA, what we will call non-metro areas, accounted for the other 35 percent, a loss of 28,800 jobs. These losses are disproportionate to the distribution of employment in the state (see Figure 2).
Figure 2
Indiana's Non-Farm Employment, October 1999
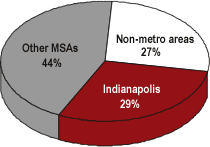
If Indianapolis had borne its "fair share" of job losses, that nine county area would have lost 24,000 jobs.
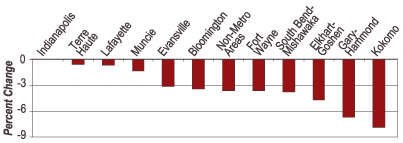
Even among the other metro areas, the record of job losses over the past three years is diverse. Figure 3 shows that the non-metro areas fall in the middle of the metro areas, which range from no change in Indianapolis to a negative 7.9 percent change in Kokomo.
Figure 3
Percent Change in MSA Non-Farm Employment
October 1999 to October 2002
Not only are the rates of job loss different in these three areas of Indiana, but the pattern or time of decline is also different. See Figure 4 where the decline begins in other metro areas before it hits Indianapolis or the non-metro areas.
Figure 4
Percent Change in Non-Farm Employment
October 1999 to October 2002
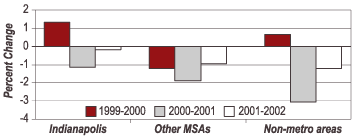
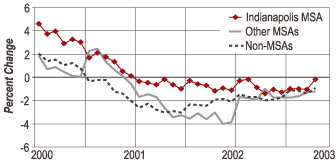
But the detailed data in Figure 5 reveal an unambiguous slowing of the economy for each of the three regions beginning in January 2000. In the other metro areas, employment was running 4 percent below a year earlier at the end of 2001. At the same time, job losses in non-metro areas of Indiana were at 2 percent and those in the Indianapolis metro area were 1 percent or less.
Figure 5
Percent Change in Non-Farm Employment from
Same Month a Year Earlier
Looking Ahead
As 2002 ends, the Indianapolis area seems poised for job increases once again. The rest of the state, although moving in the same direction, is still lagging behind. Of the 30,000 jobs expected to be gained in the entire state over the course of the next year, more than half are likely to be in the Indianapolis area itself.
Also in this Issue…
- Outlook for 2003
- The U.S. Economy
- The International Economy
- Financial Forecast
- Housing
- Indiana
- Anderson
- Bloomington
- Columbus
- Evansville
- Fort Wayne
- Gary
- Indianapolis
- Kokomo
- Lafayette
- Muncie
- New Albany
- Richmond
- South Bend/Mishawaka and Elkhart/Goshen
- Outlook Summary for 2003
- Return to Table of Contents


