A Graphic Overview of Employment and Earnings in the 1990s
Indiana Business Research Center, Kelley School of Business, Indiana University
The 1990s were a fascinating decade for the American economy. We opened with a recession and ended in a boom. This article offers a summary of the employment and earnings during the decade with emphasis on industries and states. While many people are focused on the warts of the decade now being revealed, history may yet record the 1990s as one of our most successful eras.
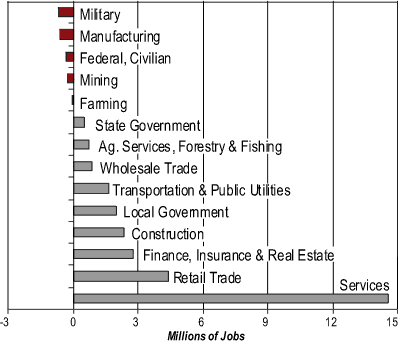
The total number of jobs in the U.S. grew by 28 million from 1990 to 2000. More than half of this growth (14.6 million) was in services with another 4.4 million jobs added in retail trade. Nine of the 14 sectors examined in this article expanded employment while the other five declined (see Figure 1).
Figure 1
Changes in the Number of Jobs in the U.S., 1990-2000
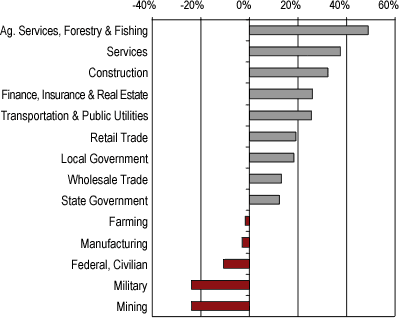
In percentage terms, the number of jobs grew by 20.1 percent in the U.S. with
agricultural services, forestry, and fishing having the strongest growth. Although
manufacturing lost nearly 600,000 jobs, the percentage decline was only 3 percent
(see Figure 2).
Figure 2
Percent Change in U.S. Jobs, 1990-2000
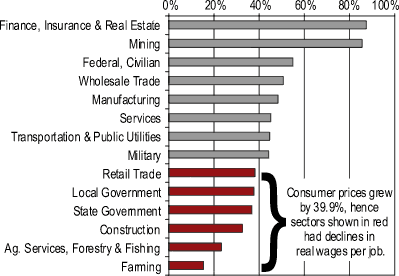
The stock market boom of the 1990s and the growth in the diversity of financial instruments allowed the finance, insurance, and real estate sector to lead the nation in percentage gain of earnings per job at 87.7 percent. Closely following was mining at 85.7 percent. The gain for all jobs was 44.3 percent. The weakest sector was farming at a mere 15.4 percent. Note that these gains are all in nominal terms and do not account for changes in prices, which grew by 39.9 percent. Thus, six of the 14 sectors had falling real earnings per job in the 1990s (see Figure 3).
Figure 3
Percent Change in Nominal Earnings per Job, 1990-2000
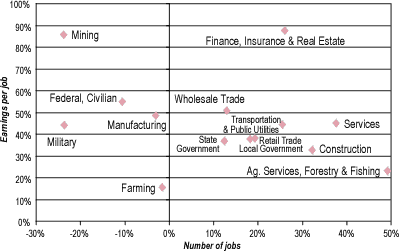
Rapidly growing job markets should indicate rapid growth in earnings per job.
This relationship was not strong in the 1990s. Agricultural services and construction
were among the top three sectors in job growth, but both had growth in earnings
per job that failed to top the 40 percent line needed to outpace inflation
in prices. Mining had the second best growth in earnings per job, but the second
lowest growth rate in jobs. This effect was probably associated with strong
productivity growth in the mining sector as capital was substituted for labor
(see Figure 4).
Figure 4
Percent Change in the U.S. by Sector, 1990-2000
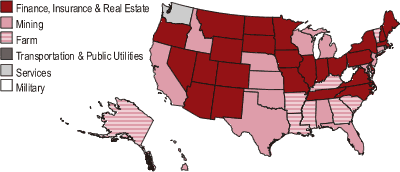
Finance, insurance, and real estate was the leading sector in growth of earnings
per job in 25 states and the District of Columbia. Mining held that honor in
14 states. Services, which was the leading source of employment gains in every
state, was the leader in earnings per job in the state of Washington. In eight
states, farming—perhaps reflecting productivity gains or changes in federal
subsidies—was the leader in earnings per job (see Figure 5).
Figure 5
Leading Sector in Growth of Earnings per Job, 1990-2000
Click for Larger Image
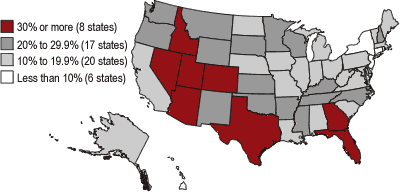
Five states in the mountain region led the nation in job growth during the 1990s. Nevada was out in front with a 65 percent increase followed at a considerable distance by Arizona and Utah at 48 percent. Only the District of Columbia lost jobs in the decade. The worst records among the states were established by Connecticut, Hawaii, and Rhode Island (see Figure 6).
Figure 6
Percent Change in Number of Jobs, 1990-2000
Click for Larger Image
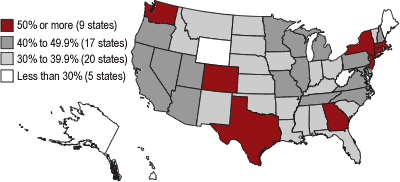
Massachusetts, Colorado, and Washington led the nation in growth of earnings per job. Also ranking in the top six were Connecticut and the District of Columbia; both of which were among the bottom-feeders in growth of jobs. Alaska, West Virginia, and Wyoming—all energy dependent states—had poor records in growth of earnings per job. Hawaii, where the tourist industry has been in trouble for a decade, was also near the bottom of the list (see Figure 7).
Figure 7
Percent Change in Earnings per Job, 1990-2000
Click for Larger Image
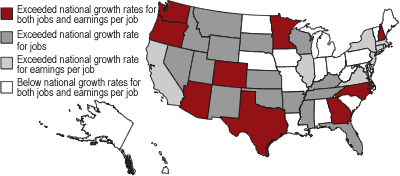
Nine states exceeded the national rates of growth in jobs and earnings per job. There is no geographic pattern, with states ranging from Georgia to Washington and New Hampshire to Arizona. Eighteen states failed to meet the national growth rates in either measure (see Figure 8).
Figure 8
Performance in Both Job Growth and Earnings per Job, 1990-2000
Click for Larger Image
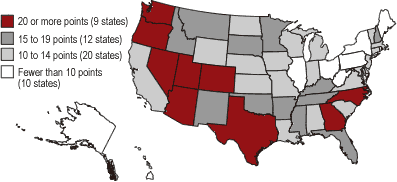
Overall performance of the states is always of interest. To get away from seeing a state look good for outstanding performance in one big sector (or looking bad for poor performance in one large sector), we developed a simple scoring device.
For each sector, each state was assessed on its performance vis-à-vis the national rate of change in jobs and earnings per job. A state could exceed the nation in each of the 14 sectors for job growth and gain 14 points in our cumulative score. Another 14 points could be earned for exceeding the nation in growth of earnings per job in each sector. If a state exceeded the nation in both measures in all sectors, it was awarded 28 points.
Texas had the highest score of all states with 25 points (22 for exceeding the nation in both measures in 11 sectors and 3 for exceeding the nation in job growth in three sectors). Colorado and Georgia tied for second with 23 points. Maine, New York, and Pennsylvania tied for 48th place with just three points each. These three states were each below the national growth rates for both job growth and earnings per job in 11 of the 14 sectors (see Figure 9).
Figure 9
Performance Relative to National Growth Rates for Jobs and Earnings per Job
for 14 Sectors, 1990-2000
Click for Larger Image
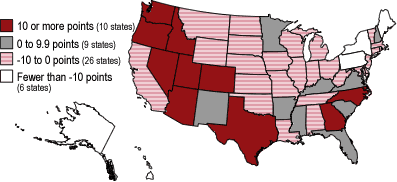
The analysis presented above is focused on national rates of change and compares each state with those rates. We know, however, that large states have more influence on these national figures than smaller states and that big sectors have more weight than smaller sectors. To avoid the large states problem and the large sector problems, we calculated the mean or average value for growth in jobs and earnings per job for each sector. Then we compared the growth for each state to this average (relative to the standard deviation of the state data) to produce a standardized number which removes the big state and big sector biases. These standardized, or z-values, were summed for each state for each measure yielding a combined z-score for each state. Under this measure, Texas does not emerge as the leading state but comes in fifth behind Nevada. Maine remains in the bottom three, but this time joined by Alaska and Hawaii (see Figure 10).
Figure 10
Alternative Performance Scoring Relative to Average State Growth
Click for Larger Image
Additional details for all sectors of each state are available in this Excel spreadsheet.


