
Housing Hoosiers
Indiana Business Research Center, Kelley School of Business, Indiana University
Mansion or trailer, townhouse or ranch, most Hoosiers live in single-family homes. The decennial census taken in April 2000 provides detailed information on the physical and financial characteristics of housing in Indiana, such as the number of rooms and bedrooms, vehicles and telephones, value, and heating fuel. Indiana's overall housing inventory is the primary focus of this article and will likely cause the reader to learn more about local areas within the state. This information is available for every county, city, town, and township in the state on STATS Indiana in a series of 60-page profiles developed from a census file named Summary File 3.
Physical Characteristics
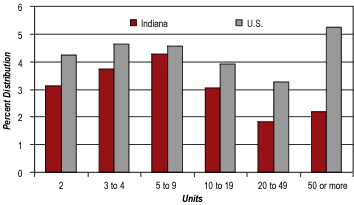
Single or double (we don't mean cheeseburgers), trailer or apartment? Most housing in Indiana consists of single-family homes (see Table 1 and Figure 1).
Table 1
Housing Units by Type: Indiana Compared to the Nation
| Types of Housing | Occupied Units | Distribution (%) | Persons Per Unit | ||
| Indiana | Indiana | U.S. | Indiana | U.S. | |
| Total Units: | 2,336,306 | 100.00 | 100.00 | 2.53 | 2.59 |
| 1, Detached | 1,699,089 | 72.73 | 61.42 | 2.72 | 2.81 |
| 1, Attached | 66,100 | 2.83 | 5.60 | 2.22 | 2.57 |
| 2 | 72,852 | 3.12 | 4.23 | 2.17 | 2.46 |
| 3 to 4 | 87,490 | 3.74 | 4.65 | 1.92 | 2.29 |
| 5 to 9 | 100,118 | 4.29 | 4.57 | 1.90 | 2.12 |
| 10 to 19 | 71,043 | 3.04 | 3.90 | 1.81 | 2.01 |
| 20 to 49 | 42,958 | 1.84 | 3.28 | 1.57 | 1.95 |
| 50 or More | 50,844 | 2.18 | 5.24 | 1.41 | 1.82 |
| Mobile Home | 145,078 | 6.21 | 7.00 | 2.46 | 2.56 |
| Boat, RV, Van, etc. | 734 | 0.03 | 0.10 | 2.25 | 1.81 |
Figure 1
Multi-Unit Housing: Indiana Compared to the U.S.
Still, 25 percent of Indiana's housing is apartments or mobile homes (571,117 such units). Most apartment dwellers are found in the metro areas of the state, with mobile home living more prevalent in southern Indiana (see Figure 2).
Figure 2
Mobile Home Share of All Housing Units by Township, 2000

Click for Larger Image
Utility gas heats the majority of Hoosier (65 percent) and U.S. (51 percent) homes. Electricity is a distant second choice with a 22 percent share in Indiana and 30 percent share nationwide. Hoosiers use more bottled, tank, or LP gas (9 percent) than is used nationwide (7 percent), but less fuel oil or kerosine (3 percent) than the U.S. average of 9 percent (see Figure 3).
Figure 3
Fuel Used for Home Heating
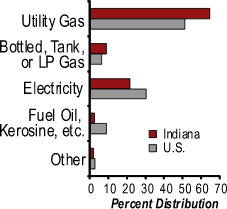
| Fuel Type | Distribution (%) | |
| Indiana | United States | |
| Occupied Units | 100.00 | 100.00 |
| Utility Gas | 64.65 | 51.22 |
| Bottled, Tank, LP Gas | 8.96 | 6.52 |
| Electricity | 21.70 | 30.35 |
| Fuel Oil, Kerosine, etc. | 2.58 | 8.97 |
| Other | 2.11 | 2.94 |
| Coal or Coke | 0.09 | 0.14 |
| Wood | 1.42 | 1.68 |
| Solar | 0.02 | 0.04 |
| Other | 0.37 | 0.39 |
| None Used | 0.21 | 0.69 |
Financial Characteristics
Most Hoosiers are homeowners—71 percent compared to 62 percent nationally.
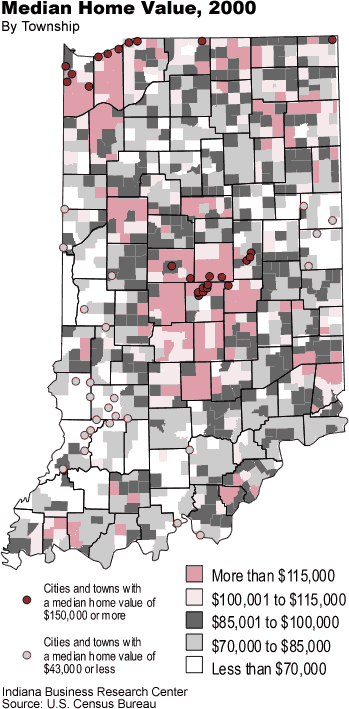
Based on Census 2000, the median value of a home in Indiana is $94,300, compared to $119,600 for the U.S. Of course, the median home value varies widely depending on location, with median values as high as $625,000 in the Indianapolis area (Crows Nest) and $390,600 in Northern Indiana (Dune Acres) (see Table 2 and Figure 4).
Table 2
Median Home Value in Indiana Cities and Towns
| Places with a Median Home Value of $150,000 or More | Places with a Median Home Value of $42,500 or Less | |||
| Crows Nest | $625,000 | $42,300 | Ridgeville | |
| North Crows Nest | $598,200 | $42,200 | Bicknell | |
| Williams Creek | $553,600 | $42,200 | Shelburn | |
| Dune Acres | $390,600 | $41,500 | Sandborn | |
| Meridian Hills | $281,900 | $41,000 | Dugger | |
| Clear Lake | $275,000 | $40,800 | Modoc | |
| Spring Hill | $270,800 | $40,800 | Wheatland | |
| Zionsville | $246,300 | $40,600 | Salamonia | |
| Ulen | $238,900 | $39,900 | Lyons | |
| Beverly Shores | $238,000 | $39,400 | Pennville | |
| Woodlawn Heights | $232,500 | $39,300 | Switz City | |
| Ogden Dunes | $222,000 | $38,800 | Carbon | |
| Long Beach | $217,500 | $37,600 | Hymera | |
| Carmel | $205,400 | $37,500 | Mecca | |
| Country Club Heights | $192,000 | $36,300 | Alton | |
| Wynnedale | $183,000 | $35,600 | Decker | |
| Winfield | $180,100 | $34,700 | Elnora | |
| St. John | $172,100 | $34,700 | State Line City | |
| Munster | $163,800 | $33,100 | Mauckport | |
| Fishers | $161,500 | $31,900 | Newberry | |
| Schererville | $157,900 | $31,300 | Crane | |
| River Forest | $156,300 | $30,200 | Edwardsport | |
| Granger | $154,600 | $29,600 | Saltillo | |
| Michiana Shores | $154,200 | $28,800 | Ambia | |
| McCordsville | $150,800 | $24,300 | Alamo Lore | |
Figure 4
Median Home Value by Township, 2000
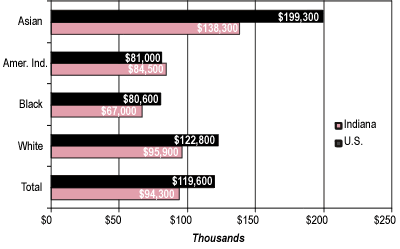
Home values also vary with the race of the homeowner, with Asians (reporting one race) having the highest median value at $138,300 in Indiana and $199,300 nationally (see Figure 5).
Figure 5
Median Home Value by Race of Householder
With homes come mortgages, utilities, and taxes. In Indiana, 71 percent of specified owner occupied homes (see definition below) have a mortgage.
Specified owner occupied units:
Financial data and some other housing characteristics
are tabulated only for those units classified by the Census Bureau as "specified."
Those units include only 1-family houses on less than 10 acres without a
business or medical office on the property. The data for "specified
units" exclude mobile homes, houses with a business or medical office,
houses on 10 or more acres, and housing units in multi-unit buildings.
Of those mortgaged homes, average monthly owner costs are $977. The mortgage is clearly the biggest financial load, since homeowners without a mortgage have average costs of only $280 a month. Indiana has a median yearly real estate tax of $868, compared to $1,334 in the U.S.
