November 2, 2026 (September data)
Many of the latest data releases point to an economy that grew faster over the summer than many had expected, even as the labor market cooled and inflation picked back up. The most notable of these, the Bureau of Economic Analysis's advance estimate, put third quarter real GDP growth at a 3.4% annual rate, up from 2.2% in the second quarter. Investment led the gain, especially business spending on equipment such as computers and other information processing equipment, and consumer spending also contributed. The September employment report was much softer: payrolls rose just 29,000, revisions took a combined 60,000 jobs off of the July and August counts, and the unemployment rate edged up to 4.2%. Price pressures picked up as well. Consumer prices rose 0.6% in September, more than half of it from a 9.1% jump in gasoline, which pushed the 12-month rate to 3.7% from 3.4%; core prices rose 2.6% over the year. Against this backdrop, the Federal Open Market Committee held the federal funds rate at 3.75–4.00% at its October meeting.
Looking under the hood with the BBKI
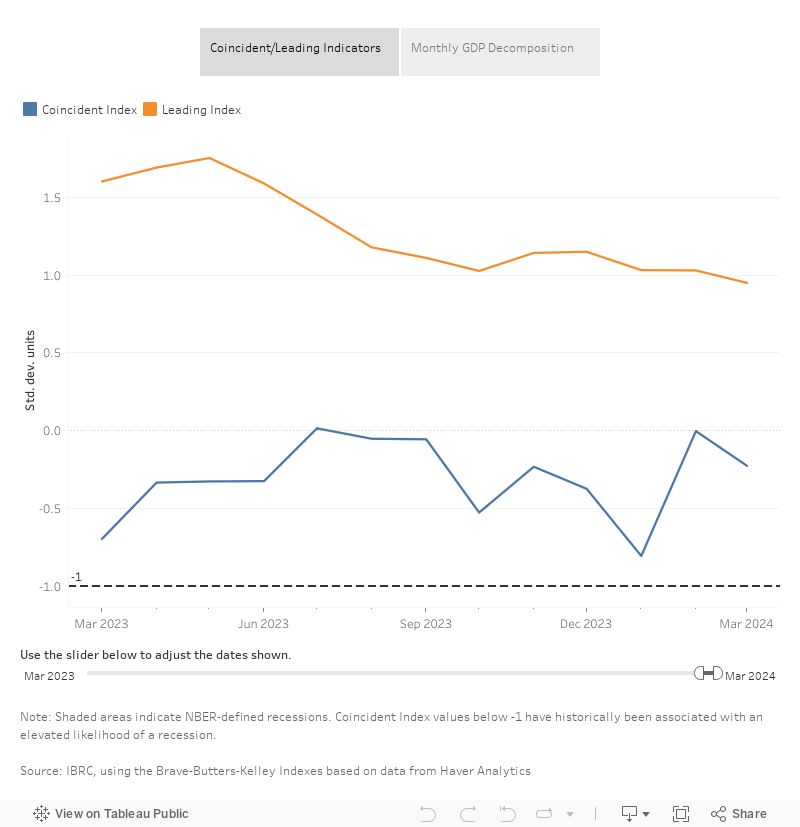
The latest release of the Brave-Butters-Kelley Indexes (BBKI) has the coincident index at 0.2 for September, up from our revised estimate of 0.0 for August. This reading places the economy slightly above trend growth, which our model estimates to be near 2.9% on an annualized basis. The uptick in September partly reflects the readings of series including industrial production, capacity utilization and the labor force participation rate, which all increased in September relative to August.
Pulling this together, the economy shows no signs of contracting and continues to expand at a pace modestly above trend. How long that expansion lasts, and how robust it proves, is likely to depend on two things: whether the business investment that has led recent growth keeps up, and whether the thus-far-resilient consumer stays strong. Together these will determine how well the economy can absorb any fiscal and monetary policy headwinds in the months ahead.
VIEW PAST RELEASES
An additional look at quarterly GDP
Get notified when the BBKI is released
Subscribe to receive a monthly email notification when the BBKI is updated.
SUBSCRIBE
What is the BBKI?
Business cycle indexes and monthly GDP growth
Because the most comprehensive measures of economic activity, such as gross domestic product (GDP), have a substantial time lag before they are published, policymakers and businessses require more timely and accurate assessments of overall economic activity in order to make better decisions. This led a group of economists from the Federal Reserve Bank of Chicago and the IU Kelley School of Business to create a set of indexes — the BBKI — that can accurately identify key turning points in economic activity earlier.
The BBKI inputs an unbalanced panel of 490 monthly measures of real economic activity plus quarterly real GDP growth extending back to January 1960. (These data broadly reflect the set of real economic activity indicators commonly used to forecast U.S. GDP growth.) The outputs include a coincident index, a leading index, and not only a measure of monthly GDP growth, but also a decomposition of it into its trend, cycle and irregular components.
The coincident index
The coincident index addresses the question: "Where are we?"
It is measured in standard deviation units and assesses the current strength of the economy. Using a threshold value of -1.0, provides a remarkably accurate (up to 99% accurate) way to gauge whether the economy is in a recession. This accuracy in gauging the strength of the economy has been shown to best many of the leading alternatives and can often come in a much timelier fashion given that the BBKI is released monthly.
The leading index
The leading index addresses the question: Where are we going?
It is a sub-component of the coincident index that isolates the economic activity that has historically been a leading signal of the trajectory of economic activity going forward. This leading index has on several occasions projected a future business cycle turning point several months before a peak or trough actually occurs — historically being the most informative about six to seven months out.
Monthly GDP growth
Each month, real GDP growth is allowed to have three separate components — each with their own separate type of dynamics — that all must add up to yield the total amount of growth or contraction.
-
Trend: This represents the very low-frequency and slow-moving component of real GDP growth. One can interpret it as the very long-run average of real GDP growth. While the trend component does not vary that much month to month, over the last several decades we have seen a noticeable decline in the long-run average of real GDP growth.
-
Cycle: This is the component of real GDP growth that reflects the business cycle. It is designed to capture systematic expansions or contractions across a variety of sectors of the economy. It is the cycle component that in many instances will be the most influential in guiding assessments about the health of the economy and public policy decisions designed to address it.
- Irregular: This component is what remains “left over,” after accounting for the trend and cycle components, to get back to the amount of growth or contraction we observed. While the BBKI methodology is designed to have the trend and cycle components reflect movements that are likely to govern the direction of growth going forward, the irregular component is designed to reflect more “one-off” or random fluctuations that are less likely to reflect where economic activity is headed in the future.
The BBKI approach identifies each of these components by breaking down the quarterly time series of real GDP and how it relates to the large set of other economic activity indicators. By leveraging the monthly indicators, it is able to construct these measures (and the aggregate) at a monthly frequency. This means the BBKI is able to provide a more detailed estimate more frequently than is reported by the U.S. Bureau of Economic Analysis.
Read more about the BBKI
Release schedule
The table below shows upcoming releases along with the data used in each release.
| Date of Release |
Monthly Data |
| December 3, 2026 |
October 2026 |
| December 28, 2026 |
November 2026 |