
New Albany
School of Business, Indiana University Southeast, New Albany
In 2002, the economy of Southern Indiana and the Louisville metropolitan area continues to perform better than national economic trends. To date, employment losses and increases in the unemployment rate in the Louisville area have not been as extreme as in other parts of Indiana, Kentucky, and many parts of the U.S. The seven counties in the Louisville Metropolitan Statistical Area (MSA) are Clark, Floyd, Harrison, and Scott counties in Southern Indiana, and Bullitt, Jefferson, and Oldham counties in Northern Kentucky. The following analysis examines various measures of economic growth in the Louisville MSA and its component counties. Three additional Indiana counties—Crawford, Orange, and Washington—in the Southern Indiana labor market area are included when data are available.
Labor Markets
The 2002 unemployment rates in the counties of the Louisville metropolitan area have declined over the year and continue to be below, or even with, that of Indiana as a whole and below that of Kentucky and the United States, as shown in Table 1. Clark and Floyd counties have higher unemployment rates than for the same period in previous years. Unemployment in Harrison County is currently among the lowest in the state, while the unemployment rate in Orange County is among the highest in the state.
Table 1
Unemployment Rates Around Louisville
Recent data for the Louisville MSA indicate that the average level of non-agricultural employment decreased by about 19,000 jobs between September 2001 and September 2002 (see Table 2). The vast majority of job losses occurred on the Kentucky side of the river. Manufacturing employment decreased by 500 jobs in Southern Indiana and about 1,300 jobs in the MSA. Non-manufacturing employment remains steady in Southern Indiana but decreased significantly (by 17,900 jobs) in the MSA during this period. The MSA job losses in the non-manufacturing sector were led by decreases in the service and retail sectors. Several major retail chains are expanding operations into Southern Indiana, which has kept retail employment steady at around 19,000 workers during 2002.
Table 2
Non-Agricultural Employment and Components
September 1999 to September 2002
Recent data from the Indiana Department of Revenue indicate that 36,300 workers commuted daily between Southern Indiana and Kentucky in 2000. This is about 1,200 fewer workers commuting from Southern Indiana to Kentucky than in 1999. The proportion of commuters originating in each county is shown in Table 3.
Table 3
Commuting Flows, 2000
Commuters as a Percent of County Workforce
Wages and Hours in Manufacturing
Manufacturing is the only sector for which wage and salary information is collected for the Southern Indiana area. Average hourly manufacturing earnings in Southern Indiana remain consistently below that of the MSA as a whole. Average hourly earnings in manufacturing industries in Southern Indiana have been consistently below that of Indiana as a whole for years (see Figure 1). Beginning in May of 2002 that trend changed, and hourly manufacturing earnings rose above the state average. This is most likely a fluctuation rather than inflationary pressure. While there is no standard measure of labor productivity for metropolitan areas, national averages suggest that labor productivity in manufacturing has increased substantially over the past decade, thus holding output prices and wages down.
Figure 1
Average Hourly Manufacturing Earnings
Average weekly hours worked in the manufacturing sector were stable at around 40 hours per week in the Southern Indiana counties until May 2002 when weekly hours began creeping up. They peaked at 45.1 hours per week in August and averaged 42 hours per week over the past year. This suggests that the increase in average earnings is due to overtime pay.
Consumer Activity
Sales and Marketing Management magazine's 2002 Survey of Buying power shows that retail sales declined over the past year. Total retail sales in the Louisville MSA decreased by 4.51 percent from $13.5 billion in 2001 to $12.9 billion in 2002. Jefferson County, Kentucky and Floyd County, Indiana had the largest decreases (on a percentage basis) between 2000 and 2001. Harrison is the only county in the MSA to show positive growth in retail sales.
Activity in the residential housing market decreased slightly over the past year. Housing sales through October 2002 in the Southern Indiana area totaled 2,144 compared with 2,242 for the January-October 2001 period and 1,840 for the same period in 2000. The sale of existing homes in 2001 totaled 2,568, which is among the highest levels of sales since 1990, suggesting that this indicator peaked in 2001. The average sale price was $123,917 for January-October 2002 sales, down 5.9 percent from the year before. The average amount of time for a house to sell was 110 days.
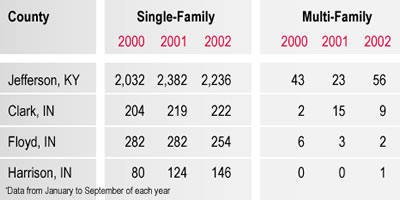
In contrast to housing sales, residential construction, as measured by residential building permits for new single-family units, decreased from the 2001 in Jefferson and Floyd counties and increased in Clark and Harrison counties. As shown in Table 4, the largest decrease in the number of single-family permits (146) occurred in Jefferson County. The largest percent decline occurred in Floyd County with a 9.9 percent decrease. The number of multi-family permits increased in Jefferson County.
Table 4
Residential Building Permits Issued for Privately-Owned Structures
Gaming at Caesar's Casino continues to expand. The turnstile count for September of 2002 was 272,262 patrons, a 28.8 percent increase over September 2001. The turnstile count for January through September 2002 was 30.8 percent higher than the same period last year. Admissions and gaming tax revenues totaled $51.72 million for the January-September 2002 period, a 7.7 percent increase over the same period in 2001.
Demographic Trends
Recently released data from the 2000 Census show that educational attainment for the adult population has increased from the 1990 level in the Louisville metropolitan area and the surrounding counties (see Figure 2).
Figure 2
Educational Attainment
Percent of Population Age 25 and Older
Income statistics from Census 2000 (see Table 5) reveal that both per capita income and median family income have grown after adjusting for inflation. The income statistics indicate substantial gains in some counties, particularly Floyd. However, income for many of the counties—Crawford, Orange, Scott, and Washington—continues to lag behind the national figures.
Table 5
Income Statistics by County
The growing Hispanic population has become a focus for local social service agencies and nonprofit groups. Table 6 shows the growth in the Hispanic population from 1990 to 2000. A substantial increase has occurred in the Louisville MSA, particularly in Clark and Jefferson counties.
Table 6
Hispanic Population Trends
Click for Larger Image
In the last few months of 2002, Louisville and the Southern Indiana area have settled into a period of sluggish growth. Unemployment rates are a bit higher than in 2001 but have been declining in most counties for the past few months and are still relatively low compared to the state and national averages. After a decline from the 2001 levels, employment growth in the non-agricultural sector reached a low point during the summer of 2002 but has been increasing for the past few months. Employment in several industries (nondurable goods and finance, insurance, and real estate) has remained stable over the past year. Consumer activity—as measured by retail sales, single-family residential building permits, and housing sales—decreased relative to the previous year.
Also in this Issue…
- Outlook for 2003
- The U.S. Economy
- The International Economy
- Financial Forecast
- Housing
- Indiana
- Anderson
- Bloomington
- Columbus
- Evansville
- Fort Wayne
- Gary
- Indianapolis
- Kokomo
- Lafayette
- Muncie
- New Albany
- Richmond
- South Bend/Mishawaka and Elkhart/Goshen
- Outlook Summary for 2003
- Return to Table of Contents
