U.S. outlook for 2023

Associate Professor Emeritus, Department of Economics, Indiana University Bloomington
A year ago, we expected that 2022 would produce a second year of economic recovery, although with deceleration from 2021. In both regards, this has (sort of) been the case.
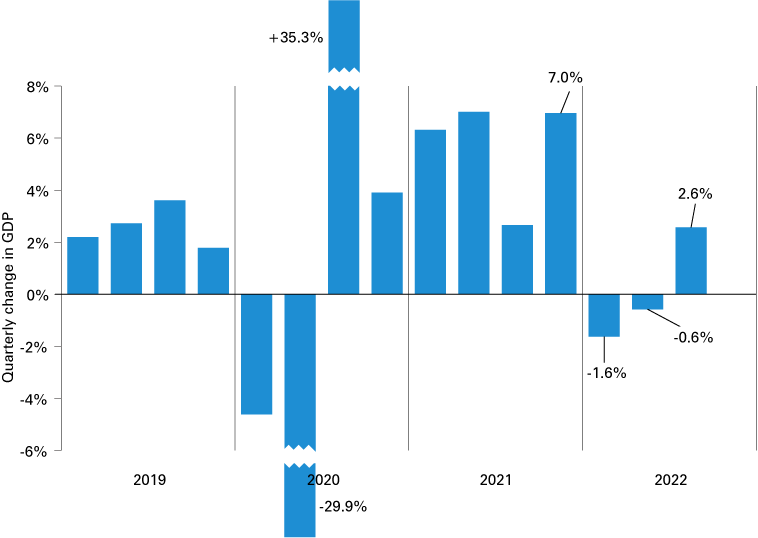
During the past year, the economy grew overall and the rate of growth slowed (see Figure 1). But the deceleration has exceeded our year-ago expectation. Over four quarters through 2022 Q3, total output grew just 1.8%, less than half the 4% we predicted in last year’s outlook. The same pattern is also present at the disaggregated, component level; consumer spending, business investment, housing construction and government purchases were all significantly weaker than we expected – the latter two actually had negative growth. The one exception was the international trade sector, where both exports and imports had growth well above expectations.
Figure 1: Rate of change in U.S. real output

Source: U.S. Bureau of Economic Analysis
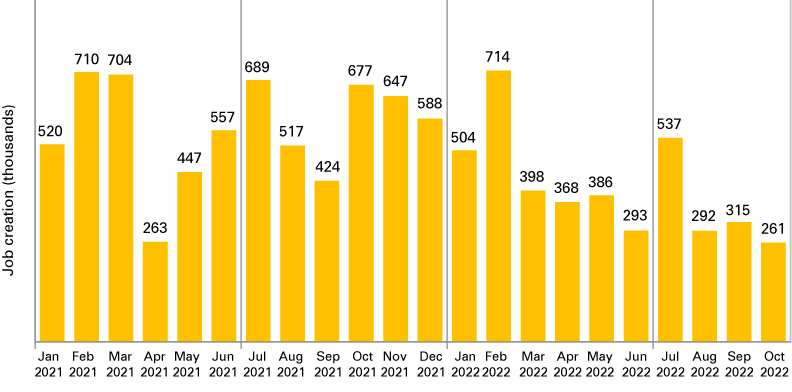
In the labor market, this qualitatively correct/quantitatively wrong pattern is also present, but with the quantitative error reversed. Over the past 12 months (through October 2022), the economy has added jobs at a rate of 440,000 per month (see Figure 2). This is about 140,000 above our year-ago expectation.
Figure 2: U.S. monthly job creation

Source: U.S. Bureau of Labor Statistics
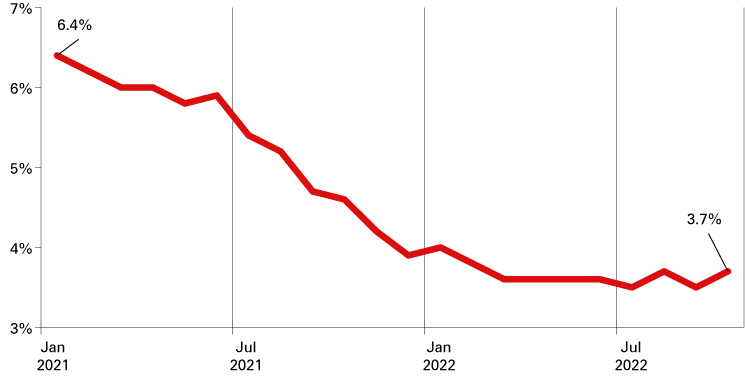
Unemployment has fallen another 0.9 points (see Figure 3) to 3.7%, nearly matching its pre-pandemic low and 0.3% lower than we expected.
Figure 3: U.S. monthly unemployment rate

Note: The latest data is from October 2022. Data is seasonally adjusted.
Source: U.S. Bureau of Labor Statistics, Local Area Unemployment Statistics (LAUS)
Finally, in one area, our concerns a year ago were fully warranted. The last three sentences of last year’s outlook were: “The economy faces serious inflationary pressures. The Federal Reserve says this will be temporary. That sounds a lot like what they said in the late 1960s and the 1970s as inflation rose from 1% to double digits.”
The Fed has clearly changed its view. And beginning in May, it has acted on its altered perception, raising its target range for the federal funds rate at its last six policy meetings by a total of 3.75% (at the time of this writing). These moves, which are the most severe in four decades, were not in our 2022 outlook. They are part of the reason for the underperformance of GDP over the past year. And they (plus any more to come) are crucial for the course of the economy in 2023.
So, what do we see for the economy in the upcoming year? The honest answer is that we don’t know. There are a multitude of plausible scenarios ranging from below-trend growth down to a significant recession. Given this wide range, we think it hubris to provide a specific forecast. In our recent forecasting for the Indiana Business Research Center, we have used two sets of assumptions to produce a pair of alternate forecasts – one that we think is optimistic and another that is moderately pessimistic. Some elements for 2023 include:
| Optimistic scenario | Pessimistic scenario | |
|---|---|---|
| Output growth | Average of 1%-1.5% | Two quarters of at or below -2% growth |
| Unemployment | Mid-year peak about 4.5% | Year-end about 6.5% |
| Employment | Increase of about 0.8 million | Decrease of about 3 million |
This is a wide range – and, in our estimation, with relatively even probability over the range. Given the economic and policy situation, we feel that presenting a single forecast would be both misleading and a fool’s errand. A better use of our effort is to consider what we think are the most important factors that will shape whatever outcome does materialize. Below, we focus on four – two domestic and two international.
First:
The behavior of domestic U.S. consumption (relative to its pre-pandemic norm) has two unprecedented distortions:
- The split of consumer spending between goods and services. The lockdown in 2020 Q2 caused a 10% drop in total consumption, but most of the decrease was in services (down 12.1%) with spending on goods hardly affected (down 2.8%). This goods/services divergence has been persistent. At present (2022 Q3), goods consumption is 15.2% above its pre-pandemic level, while services are up just 5.8%.
- The relationship between total consumption spending and the level of household after-tax income. During 2020 and 2021, government COVID payments greatly increased income relative to consumption, producing a rise in household saving. The saving rate, which averaged 8.8% during 2019, was nearly 20% in 2021 Q1, then receded. During 2022, the rate has been below its 2019 level. Over this three-year period, the mound of extra saving grew to around $2 trillion and has fallen back (so far) by about one-third.
Second:
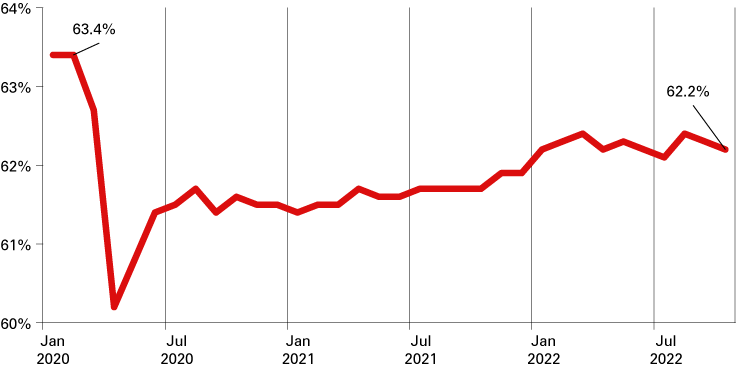
The current situation in the U.S. labor market is also unprecedented. As shown in Figure 4, the labor force participation rate (the labor force relative to the working-age population) is below its pre-pandemic level by 1.2 percentage points. That may not sound like much, but it amounts to over 3 million “missing” workers. Further, the participation rate shows no signs of imminent increase. With unemployment at a historic low, we have an economy that is facing a systemic shortage of labor.
Figure 4: Labor force participation rate

Note: The latest data is from October 2022. Data is seasonally adjusted.
Source: U.S. Bureau of Labor Statistics
For 2023, these situations raise crucial questions.
- Will the goods/services split return to “normal?” If so, how will goods-producing industries handle the significant decrease in their sales? Problems here would increase the risk of recession and would also delay recovery.
- Will the remaining excess saving allow consumer spending to hold up in the face of high interest rates and income that is not keeping up with inflation? If not, given that consumption is two-thirds of the economy, the outlook for next year will be darker.
- Will the missing workers remain missing? Will firms hoard workers in the face of declining sales? If so, the adjustments that will be needed to avoid recession and to speed recovery will be more difficult.
Third:
In the international realm, the first issue is the war in Ukraine. If things go badly there (whatever that means), nothing else may matter.
Fourth:
The second international danger is in the financial domain. For most of the period since the financial crisis, central banks in developed countries have pegged their policy rates at or even below zero. Private sector firms (especially financial firms) have responded by reordering their operations to this new, bizarre environment. Some of these accommodations will become problematic or worse as central banks now return us to more normal interest rates. They are financial land mines waiting to be triggered. In late October, the UK government stepped on one. That explosion does not seem to have caused wider damage. We may not be so lucky the next time.
Conclusion
To sum up, the economic outlook for 2023 is uncertain in the extreme. If a lot of things go right, we could end up with reduced inflation, strong consumer spending and slow growth. Or with a mild recession. If a financial outburst or black swan event materializes, possibly something significantly worse.


