Indiana’s outlook for 2023

Associate Professor of Finance, Indiana University Division of Business, IUPUC

Assistant Professor of Management, Indiana University Division of Business, IUPUC
It’s been nearly three years since COVID-19 invaded, causing its unprecedented supply shocks to global production systems. People and their leaders throughout the world are still responding to vexing economic conditions that continue to plague us.
In last year’s Indiana outlook, we predicted a slow level of growth at 2.2% alongside tight labor markets, noting a discontinuous drop in labor force participants.1 We wrote:
“The current supply chain structure, which is built upon international trade important to Indiana’s economy, is experiencing unprecedented bottlenecks on a grand scale.”
Around the world, the initial multi-governmental response to COVID’s economic impact was to (a) shut down and go home, (b) issue several rounds of fiscal stimulus2 and (c) apply accommodative monetary policies.3
The stimulus-enhanced recovery plan seemed to be working well into 2021. However, by May of 2021 and every month since, the U.S. has experienced annualized inflation rates at 5% or more.4
Last year, economists throughout the world were unclear to what extent price instability was a function of supply-chain disruptions, demand shifts, wages or some combination thereof, and whether that instability would warrant monetary policy action. The U.S. Federal Reserve hesitated until April 2022 to begin battling inflation, which had nearly a year to build by that point.5 But once the Fed began its war on inflation, they moved more quickly and aggressively than at any time since the days of stagflation from 1979 to 1982.
Indiana is a manufacturing leader and the current battle against inflation presents several risks to our economy.
Risks to Indiana’s economy for 2023
1. Work from home. An emphasis on home office construction has stoked remote-work demand everywhere, with city centers now confronted with the fallout from business evacuations.6 These new conditions, if permanent, present risks to Indiana city centers.
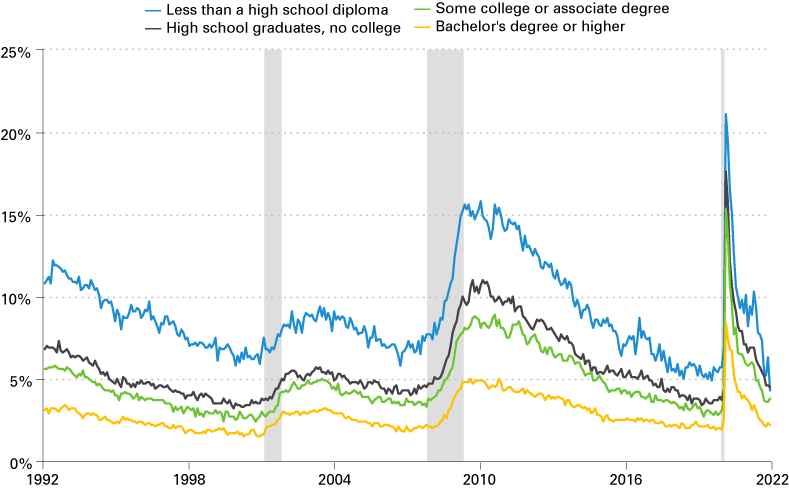
2. College enrollment declines. Undergraduate college enrollment dropped 5.9% in America in 2021, resulting in higher education losing nearly 613,000 students.7,8 Indiana’s college enrollment from high schools dropped to 53% in 2020, a decline from 65% in 2015.9 Nationally, unemployment rates for those with a baccalaureate degree are 48.8% better than non-college graduates (see Figure 1).10 Additionally, college graduates earn nearly $1 million more in lifetime earnings versus non-college graduates.11 The wage gap between high school graduates and college graduates in the U.S. hit an all-time record high in 2022.12 With fewer Hoosiers entering college today, this presents a threat to Indiana’s workforce development in the future.
Figure 1: National unemployment rates for people age 25+ by educational attainment

Note: Shaded areas represent recessions as determined by the National Bureau of Economic Research. Data is shown from January 1992 to February 2022.
Source: U.S. Bureau of Labor Statistics
3. Increased manufacturing reliance. Indiana has historically led the nation in manufacturing output as a percent of gross state product, and disruptions to the global supply chain affect production and labor opportunities in Indiana.13
The effect of the war in Ukraine has been to spike energy and food costs even higher during a time when inflation was already the key economic concern.14 To combat inflation, the Fed, alongside many other central banks throughout the world, initiated a swift protocol of monetary tightening. The resulting rate increases have steeply increased the cost of debt financing of Indiana-made durable goods in a time span of just eight months. We expect inflation to linger until the summer of 2023 before the Federal Reserve might begin to ease monetary conditions, lowering financing costs of durable goods.
4. Automotive production and the effect on gross state product expectations in 2023. The economic shocks of combatting COVID-19, the Ukraine war and inflation have caused vehicle sales in the U.S. to decline to a level not seen since 1981 (see Figure 2).
Figure 2: Total annual U.S. new vehicle unit sales
Note: Data are seasonally adjusted.
Source: U.S. Bureau of Economic Analysis, Total Vehicle Sales [TOTALSA], retrieved from FRED, Federal Reserve Bank of St. Louis, https://fred.stlouisfed.org/series/TOTALSA.
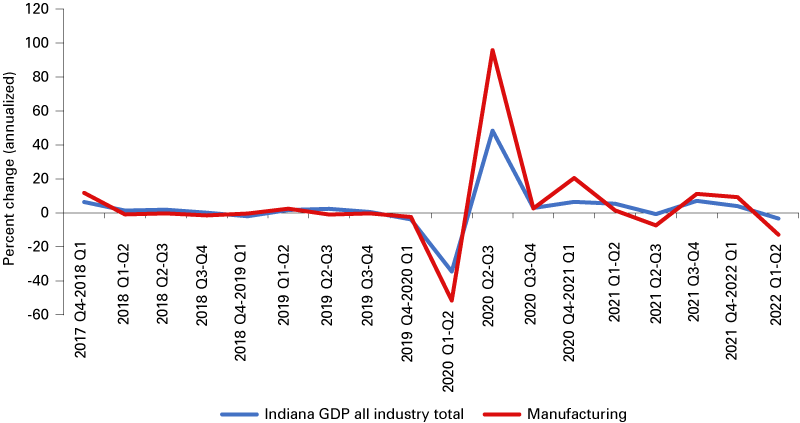
Indiana’s durable goods manufacturing constitutes approximately 17.3% of the state gross product and supply-chain disruptions and monetary tightening have a considerable impact on productivity.
Figure 3 displays the roller-coaster output pattern of a manufacturing-heavy economy.
Figure 3: Indiana quarterly GDP change

Source: U.S. Bureau of Economic Analysis, Real GDP by state [SQGDP9], retrieved from Bureau of Economic Analysis: https://www.bea.gov/data/gdp/gdp-state, October 27, 2022.
The cyclical nature of automotive and light truck sales is being exacerbated by the increase in interest rates. Expected manufacturing job losses in 2023 will likely be offset by strength in the pharmaceutical industry and, to some degree, inventory replacement of vehicles.
Figure 4: U.S. monthly vehicle production, inventory and CPI
Sources: U.S. Bureau of Economic Analysis, Domestic Auto Production [DAUPSA], retrieved from FRED, Federal Reserve Bank of St. Louis, https://fred.stlouisfed.org/series/DAUPSA.
U.S. Bureau of Economic Analysis, Domestic Auto Inventories [AUINSA], retrieved from FRED, Federal Reserve Bank of St. Louis, https://fred.stlouisfed.org/series/AUINSA, November 2, 2022.
U.S. Bureau of Labor Statistics, Consumer Price Index for All Urban Consumers: New and Used Motor Vehicles in U.S. City Average [CUSR0000SETA], retrieved from FRED, Federal Reserve Bank of St. Louis, https://fred.stlouisfed.org/series/CUSR0000SETA, November 2, 2022.
5. Ultra-tight labor market in Indiana hinders growth prospects for 2023. As a manufacturing center for the U.S., Indiana experiences elevated levels of labor volatility as cyclical firms flex their employment in reaction to changes in environmental conditions. Naturally, this affects automotive and durable goods, and as our economy cools, Indiana typically leads the way in terms of job losses.
Indiana’s economy will likely feel the pain of recession before other states. Indiana has risk in terms of anticipated job losses, particularly in the manufacturing sector, in mid-to late 2023. On the upside, Indiana historically regains jobs sooner than most other states.
The U.S. labor force participation rate (LFPR) was measured at 62.2% as of October 2022. In Indiana, the LFPR was 63.3%, up from a low of 60.8% in April of 2020. Indiana’s labor force in September 2022 was about 3.4 million, when the LFPR was also at 63.4%. Each LFPR point reflects about 53,600 Hoosiers either in or out of the labor force.15
The current labor force in Indiana includes about 3.4 million Hoosiers, with about 95,000 Hoosiers looking for work currently.
Predictive analysis
The last three years have brought about more moving parts in the economy than at any time since the Great Recession. Because of these various moving parts, we created a model that provides stochastic variation in some of the inputs affecting GDP and employment. We ran the model 1,500 times for three results in the Indiana economy: (1) Effect on unemployment rates (UE3), (2) Effect on labor force participation rates (LFPR) and (3) Effect on GDP. Results from this analysis are shown below in Table 1.
Table 1: Simulation results for changes to three variables in the Indiana economy expected in 2023
| INDIANA 2023 EXPECTATIONS | Unemployment rate |
Labor force participation rate |
Change in state GDP |
|---|---|---|---|
| Mean | 4.9% | 62.3% | 0.0% |
| Median | 4.9% | 62.3% | 0.0% |
| Likely minimum | 4.2% | 61.4% | -2.2% |
| Likely maximum | 5.5% | 63.2% | 2.2% |
| Standard deviation | 0.3% | 0.5% | 1.0% |
| Employment & output changes | 65,005 | 58,944 | 39,530 |
Source: Authors’ calculations, using a Monte Carlo simulation (N = 1,500)
Outlook
Looking at 2023, Indiana, as a manufacturing leader, will feel the pressure of the Federal Reserve tightening as we forge a new business cycle. Ultimately, we expect a relatively flat trajectory in terms of output, while confronting a real possibility of shedding jobs. If inflation remains high for the next several months, Fed tightening will likely continue, demand for durable goods will continue to decelerate and job losses in Indiana are likely to become more severe. If inflation begins to trend down as we move into the early months of 2023, Fed tightening may slow or pause, and Indiana labor markets will sustain fewer job losses.
Notes
- Ryan Brewer and Timothy F. Slaper, “Indiana’s outlook for 2022,” Indiana Business Review, https://www.ibrc.indiana.edu/ibr/2021/outlook/indiana.html
- “Fiscal monitor database of country fiscal measures in response to the COVID-19 pandemic,” International Monetary Fund, October 2021, https://www.imf.org/en/Topics/imf-and-covid19/Fiscal-Policies-Database-in-Response-to-COVID-19
- Tobias Adrian and Fabio M. Natalucci, “This chart shows how central bank interest rates have changed,” World Economic Forum, August 16, 2022, https://www.weforum.org/agenda/2022/08/central-banks-hike-interest-rates-inflation-pressures
- “Current U.S. inflation rates: 2000-2022,” U.S. Inflation Calculator, https://www.usinflationcalculator.com/inflation/current-inflation-rates/
- Board of Governors of the Federal Reserve System (U.S.), Federal funds effective rate [FEDFUNDS], retrieved from FRED, Federal Reserve Bank of St. Louis, https://fred.stlouisfed.org/series/FEDFUNDS
- Tim Henderson, “As remote work persists, cities struggle to adapt,” PEW, May 24, 2022, https://www.pewtrusts.org/en/research-and-analysis/blogs/stateline/2022/05/24/as-remote-work-persists-cities-struggle-to-adapt
- Todd Sedmak, “Spring undergraduate enrollment down 5.9%; steepest decline so far since the pandemic,” National Student Clearinghouse, April 29, 2021, https://www.studentclearinghouse.org/blog/spring-undergraduate-enrollment-down-5-9-steepest-decline-so-far-since-the-pandemic/
- Audrey Williams June, “Spring enrollment's final count is in. Colleges lost 600,000 students,” The Chronicle of Higher Education, June 10, 2021, https://www.chronicle.com/article/spring-enrollments-final-count-is-in-colleges-lost-600-000-students
- Dylan Peers McCoy, “Indiana's college going rate lowest in a generation,” WFYI Indianapolis, June 9, 2022, https://www.wfyi.org/news/articles/indianas-college-going-rate-lowest-in-a-generation
- U.S. Bureau of Labor Statistics, “High school graduates with no college had unemployment rate of 4.5 percent in February 2022,” TED: The Economics Daily, March 9, 2022, https://www.bls.gov/opub/ted/2022/high-school-graduates-with-no-college-had-unemployment-rate-of-4-5-percent-in-february-2022.htm
- Sarah Hansen, “The payoff for a college degree is smaller if you're a low-income student,” Money, January 25, 2022, https://money.com/college-roi-low-income-students-report/?xid=nasdaq&utm_source=nasdaq&utm_medium=rss_synd&ref=%2Fwage-gap-college-high-school-grads%2F
- Adam Hardy, “The wage gap between college and high school grads just hit a record high,” Money, February 14, 2022, https://www.nasdaq.com/articles/the-wage-gap-between-college-and-high-school-grads-just-hit-a-record-high
- “Percent distribution of manufacturing real gross domestic product by state in 2021 (millions of 2012 chained dollars),” StatsAmerica, https://www.statsamerica.org/sip/rank_list.aspx?rank_label=gsp2_b&item_in=12&ct=S18
- Inflation (CPI), OECD Data, https://data.oecd.org/price/inflation-cpi.htm
- Authors’ calculations


