Fort Wayne forecast 2023

Director of the Community Research Institute, Purdue University Fort Wayne

Associate Professor of Economics, Purdue University Fort Wayne
As the second-largest city in the state, Fort Wayne is not immune to the curious alignment of current economic pressures, namely uncomfortably high inflation coupled with near record-low unemployment.
In September, the Fort Wayne metro area – consisting of Allen, Wells and Whitley counties – had a non-seasonally adjusted unemployment rate of 2.0% according to Indiana Department of Workforce Development data, compared to 2.2% statewide and 3.3% nationally. The Fort Wayne metro has enjoyed “full employment,” i.e. an unemployment rate below 5%, since October 2020, with the pandemic low of 1.4% in December 2021. In other words, the lack of available workers to fill open positions remains ever present with no obvious end in sight.
In contrast, inflation, especially for food and energy, continues to weigh on the local, state and national economies alike. The U.S. Bureau of Labor Statistics’ Midwest Consumer Price Index (CPI) showed piped gas service up 17.4% in October, as compared to 12 months prior, while food at home, better known as groceries, was up 13.2% in that same time period. These two household essentials are inescapable costs, especially as families and individuals prepare for the winter heating season. While shoppers can make different choices in their grocery cart (think swapping out beef for poultry), natural gas service gives little choice or substitution options.
For the 2023 Fort Wayne outlook, we look at historical trends in the housing market and predictions for the upcoming year’s unemployment rate modeled using historical labor market information plus CPI data. This modeling estimates unemployment rates for the Fort Wayne metro at around 2% next year.
Fort Wayne-area housing market
As of this writing, the interest rate on a 30-year, fixed-rate mortgage has cracked the 7% threshold, making it the highest it has been in two decades and decreasing the affordability of new home purchases. The Federal Reserve’s increased interest rates come as the central bank seeks to curb inflation.
Looking at the housing market as an economic bellwether, we used data from the Upstate Alliance of Realtors (UPSTAR) Multiple Listing Service, serving the seven-county region of Adams, Allen, DeKalb, Huntington, Noble, Wells and Whitley counties.
We created a 10-year time series of monthly data for a variety of relevant data points to understand how the housing market has changed over time and how those numbers are shifting under current conditions. The housing market has natural seasonal fluctuations, so some of the recent changes may reflect the calendar and not overall market trends.
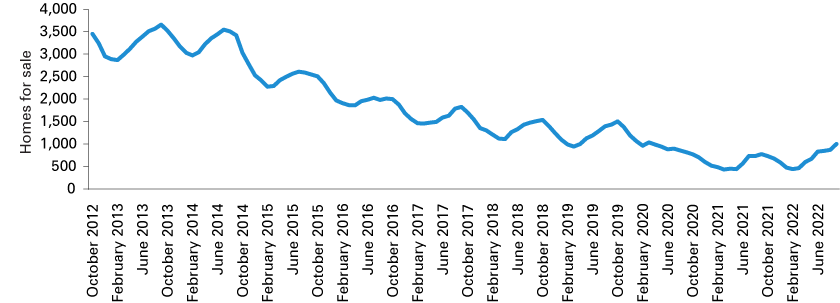
The inventory of homes for sale – the number of properties for sale in active status at the end of a given month – coupled with months supply of inventory is a good place to start.
In September, the seven-county region had 1,002 houses available for sale, which reflected a 29.3% jump from September 2021’s 775 units. The last time the Fort Wayne area had more than 1,000 listed homes was March 2020. For comparison, 2019 had an average of 1,211 available homes monthly.
Figure 1: Fort Wayne-area inventory of homes for sale

Note: Data are shown through September 2022.
Source: Upstate Alliance of Realtors (UPSTAR) Multiple Listing Service
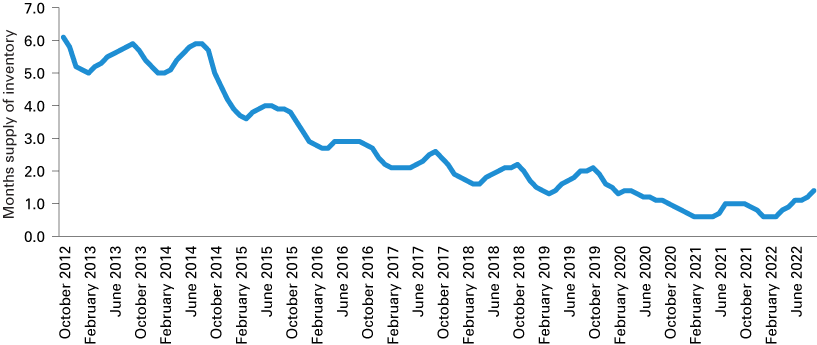
UPSTAR reports the months supply of inventory, which is calculated by the inventory of homes for sale at month’s end divided by the average monthly pending sales from the last 12 months. Somewhere between four and six months of inventory is considered a “balanced” market, favoring neither buyers nor sellers. Less than that and it’s a seller’s market; more than that would be a buyer’s market. Using the four-month threshold, the Fort Wayne area has been a seller’s market for more than seven years (it was last at four months of inventory in July 2015). For the six-month mark, one has to go back to October 2012.
In 2022, January to May had less than a month’s supply of inventory. From June through September, inventory ranged from 1.1 to 1.4 months. Despite the recent uptick in available listings, Fort Wayne remains a solid seller’s market.
Figure 2: Fort Wayne-area months supply of inventory

Note: Data are shown through September 2022.
Source: Upstate Alliance of Realtors (UPSTAR) Multiple Listing Service
As for average closed sales price, UPSTAR data shows September at $254,031, up 8.8% from $233,388 in September 2021. The Fort Wayne-area average sales price first crossed the $200,000 mark in May 2020 and has been above that price since January 2021. Comparing October 2012’s average of $134,107 to the most recent number, the average closed sales price escalated 89.4%.
Figure 3: Fort Wayne-area average sales price

Note: Data are shown through September 2022.
Source: Upstate Alliance of Realtors (UPSTAR) Multiple Listing Service
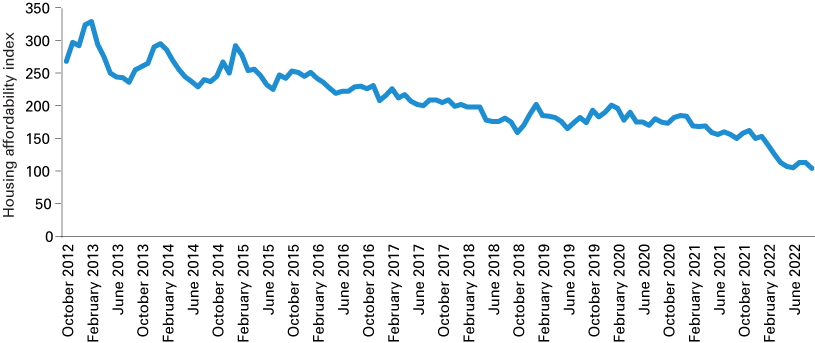
While the increasing average sales price creates equity for sellers, the housing affordability index in the Fort Wayne area was declining long before the Federal Reserve started raising interest rates. The housing affordability index is calculated from median household income, median sales price and prevailing interest rates. The higher the number, the higher the affordability. A housing affordability index of 200 means the median household income provides 200% of the income needed to purchase a median-priced home at current interest rates. The Fort Wayne area has long enjoyed a reputation for affordable housing stock, but recent trends indicate housing purchases are becoming out of reach for more households, especially if they do not currently own a house to gain the benefit of the recent price appreciation.
In the past decade, the local housing affordability index peaked in February 2013 at 329. The lowest was September of this year at 104, which is not surprising since interest rates have been climbing over the summer while house prices stayed steady. In that 10-year time period, the index first dipped below 200 in December 2017, but has been below that number since January 2020, marking almost three years below 200.
Figure 4: Fort Wayne-area housing affordability index
Note: Data are shown through September 2022.
Source: Upstate Alliance of Realtors (UPSTAR) Multiple Listing Service
Looking at the recent performance of the local housing market coupled with anticipated increases in interest rates, we offer the following observations about the Fort Wayne-area market for 2023:
A Great Recession-style housing crash is unlikely because the market fundamentals in 2022 and 2023 are materially different from 2008 and 2009. Lenders have been far more stringent in approving financially capable buyers – gone are the days of the 2-1 buydown and the no-doc loan – plus buyers who need to sell are likely to find a market of buyers ready to pay. For example, foreclosures consisted of 0.5% of the third quarter’s new listings this year at a total of 14 units compared to 569 foreclosed units listed for sale in the third quarter of 2008.
Could housing prices dip in the next 12 to 24 months? Never say never, but they are unlikely to crater based on the fact that the Fort Wayne area, like the rest of the country, does not have enough housing units to meet market demand, even if the number of buyers temporarily scales back while interest rates climb.
While the number of available houses may go up, it is likely to remain a seller’s market when measured in months of inventory, as it would take hundreds if not more than 1,000 additional listed properties to flip back to a buyer’s market. This is unlikely with high interest rates because many owners who have mortgages at or below a 3% interest rate or who own their houses outright have minimal interest in selling in 2023.
Purchasing a home will increasingly become out of financial reach for more buyers, especially first-time buyers, as interest rates climb and prices either stabilize or tick up slightly.
Buyers who do enter the market in 2023 are likely to face less competition – fewer multiple-offer situations, the ability to negotiate with the seller for concessions like closing costs or request repairs as a result of the inspection. While few buyers are delighted at paying 7% interest rates, especially as high interest rates diminish housing affordability, the old real estate adage remains truer than ever: Date the rate, but marry the house. If (or hopefully when) rates decline, owners can refinance while having locked in current prices.
For sellers, price reductions that were unheard of in 2020 or 2021 may return in 2023, but a well-priced house could still bring in a near full-price offer, think 97% or above. In September, closed sales commanded 98.2% of the original list price compared to 99.9% for 12 months prior. Since this metric looks at a multicounty region and not the unique dynamics of a particular neighborhood, variation is to be expected based on location. A fully renovated house in an in-demand, historic downtown neighborhood may be able to command an above-list price while an as-is property that’s been on the market for a few weeks and needs significant work may prompt buyers to lowball their offer.
In sum, the Fort Wayne-area housing market faces more uncertainty – prices, inventory, affordability – going into 2023, which is an uncomfortable place for buyers and sellers alike, especially after the pandemic-fueled frenzy of low interest rates and remarkable demand of the past two and a half years. The market shifts should be more incremental than seismic in the next year, barring any unforeseen shocks.
Labor market outlook
Looking ahead to the 2023 unemployment rate for the Fort Wayne metro, our modeling suggests more of the same of what we experienced in 2022: full employment with little slack of unemployed workers seeking paid employment, absent any shocks to the economy.
Over the past year, the unemployment rate for the Fort Wayne MSA started with a low of 1.4% in December 2021 and as of September 2022, we stand at an unemployment rate of 2%. It reached a max of 3.2% in July 2022. These measures are well below the natural rate of unemployment of approximately 4%.
For the 2023 unemployment forecast, all econometrics models employed seem to come to the same conclusion that next year’s unemployment rate is expected to hover close to 2%. Seasonally adjusted data of unemployment and the CPI from the Federal Reserve Economic Database at the Federal Reserve Bank of St. Louis are used in the econometric modeling. The sample range for the data is from January 1990 to September 2022.
To forecast unemployment, we used the following econometric models:
An autoregressive model with four lags,
An autoregressive model with four lags with the removal of the statistically insignificant third lag of unemployment, and
A vector autoregression (VAR) with two to six lags using unemployment and inflation as calculated by using the CPI.
Outlook
The above econometric models produced similar forecasts of unemployment being very close to 2% throughout 2023. We can expect some variation on the actual monthly data due to seasonal variation like summer student workers or holiday hiring, since local data aren’t adjusted seasonally at the time of release. Regardless, employers who are hoping for an influx of unemployed workers on which to draw are likely to be disappointed next year barring any unforeseen, additional shocks to the overall economy.


