Bloomington forecast 2023

Director and Executive Editor, Indiana Business Research Center, Indiana University Kelley School of Business
Thanks to the Bloomington Chamber of Commerce and Bloomington Rotary Club, we kicked off our annual economic outlook tour in fine fettle this year, despite spreading news of a potential recession next year. Now, we are taking what we told the audience early in November and putting it on digital paper, focusing on the Bloomington metropolitan area. The Bloomington metropolitan area is so named because Bloomington is the largest city in the two counties that comprise the federally defined region, Monroe and Owen counties.
As the two maps below show, Monroe County is the job hub for Owen County, as well as Greene and Lawrence counties, which arguably should be part of the Bloomington metro definition. Commuting into a large city or county (of 50,000 or more in population) is a critical piece of the definition of a metropolitan statistical area. Nearly 17,000 people living in other counties commute into Monroe County for work, while fewer than 7,000 of the county’s residents commute outside of Monroe County for their jobs (Figure 1).
Figure 1: Commuting into and out of Monroe County, tax year 2020
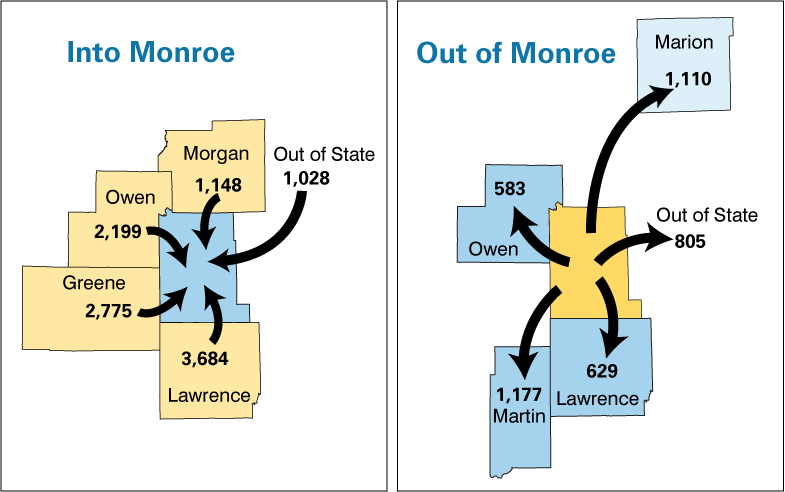
Source: STATS Indiana commuting profiles, based on Indiana IT-40 tax returns for tax year 2020
People
The Bloomington metro has been growing, albeit quite slowly, since 2010, according to U.S. Census Bureau counts and estimates (Figure 2). On paper, some of that slow growth is likely due to the undercount of college students, who typically would have been counted in the 2020 decennial census but for two things: COVID-19 and the Trump administration.
Figure 2: Bloomington metro population
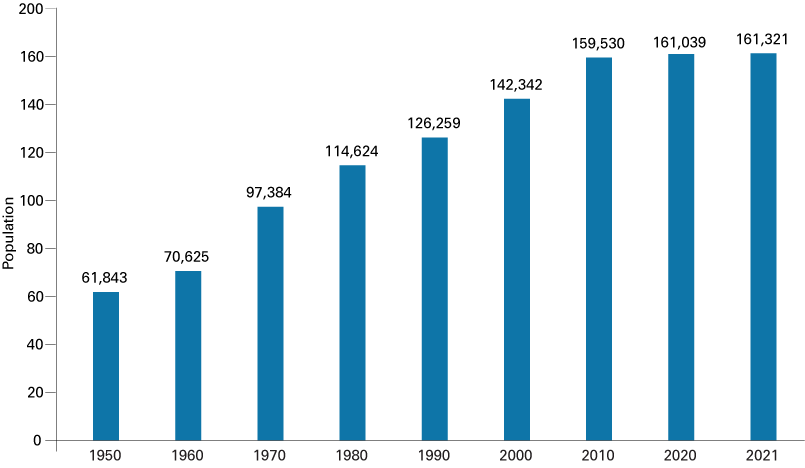
Source: U.S. Census Bureau population counts (1950-2020) and estimates (2021)
COVID-19 caused what some may call “the Great Pandemic Panic of 2020” (okay, I just thought that up), when students from colleges and universities throughout the United States left their campuses to take classes virtually from somewhere else just when census takers descended on their dormitories to count them. The Trump administration also determined that the 2020 Census would not get extra time (that many demographers, policymakers, public officials and Census Bureau staff deemed necessary) to count the entire population.
Regardless, it is clear that population growth in the Bloomington metro has slowed and a larger percentage of that population appears to be students enrolled at the university (Figure 3). The population of Monroe County shows a decline from the 2015 and 2021 population estimates (but see my earlier remarks about the effect of the pandemic on the census count)(Figure 4).
Figure 3: IU Bloomington campus headcount, percent of total metro population

Source: Indiana University, University Institutional Research and Reporting
Figure 4: Monroe County population
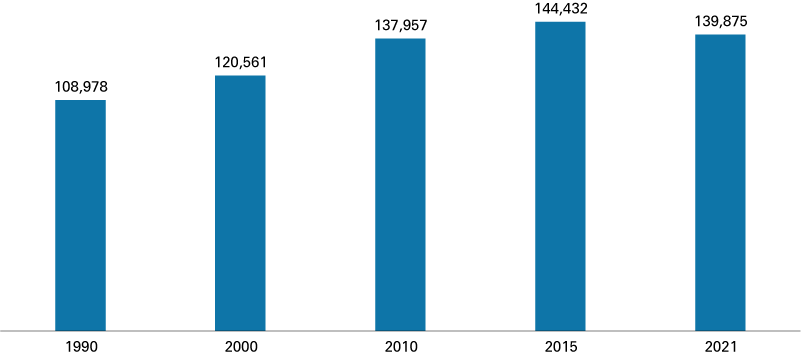
Source: U.S. Census Bureau population counts (1990-2010) and estimates (2015 and 2021)
Housing
The majority of housing in the metro area consists of single-family units. In 2021, there were nearly 42,000 single-family units, compared to slightly more than 19,000 multi-unit structures (in other words, buildings with two or more apartments or condominiums). The region also has more than 7,000 units that are used for seasonal or recreational use in places near public lands or water, such as Lake Monroe (Figure 5).
Figure 5: Bloomington metro housing units, 2021
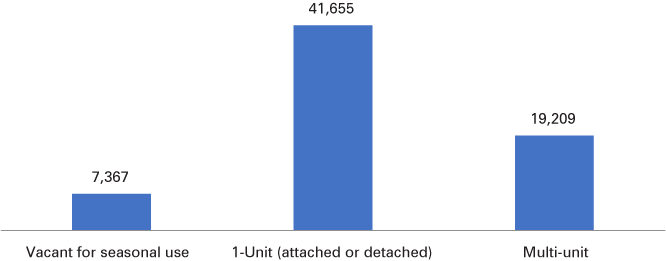
Source: U.S. Census Bureau, American Community Survey 5-year estimates, 2021
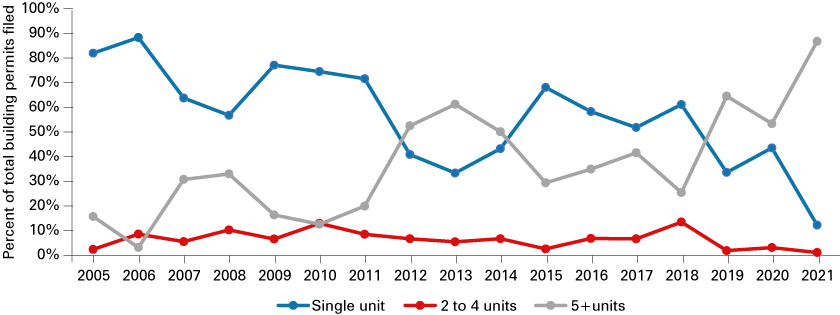
There has been a post-pandemic boom in housing development in the region, with more than 2,000 permits for building residential units filed in 2021. This is roughly quadruple the number seen in most of the past 15 years. There has particularly been a boom in building permits for multi-unit structures with five or more units, which accounted for 87% of the building permits filed in 2021 (Figure 6).
Figure 6: Residential building permits filed by type of structure
Source: U.S. Census Bureau, Building Permits Survey
Many of the people seeking housing in Monroe or Owen counties can attest to a housing crunch either because of scarcity or price. For those seeking to buy a home, Table 1 provides the most current data available (at the time of this writing) for listings, sales, price and inventory for each of the two counties in the Bloomington metro area.
Table 1: Year-to-date housing market items for Monroe and Owen counties
| Monroe | Owen | |||
|---|---|---|---|---|
| 2021 | 2022 | 2021 | 2022 | |
| New listings | 1,990 | 1,971 | 196 | 184 |
| Closed sales | 1,749 | 1,590 | 174 | 149 |
| Median price | $262,250 | $278,000 | $180,000 | $220,000 |
| Inventory of homes for sale | 377 | 446 | 41 | 50 |
Note: Year-to-date values are from January through October for each year.
Source: Indiana Association of Realtors, Local Market Update, October 2022
Forecast: Employment, income and productivity
Now we move into our forecast for the metro. At the time of publication, our forecasts for the U.S. and state of Indiana, which provide the foundational assessments of when and why we might experience a mild-to-hard recession next year, reflect differing outcomes for 2023 and 2024. Overall, we anticipate a mild retraction of the economy in Bloomington through the next year, essentially slowing growth in jobs, wages and productivity.
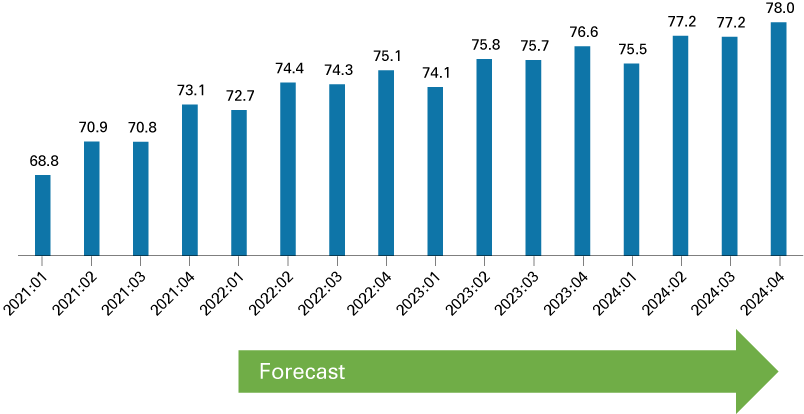
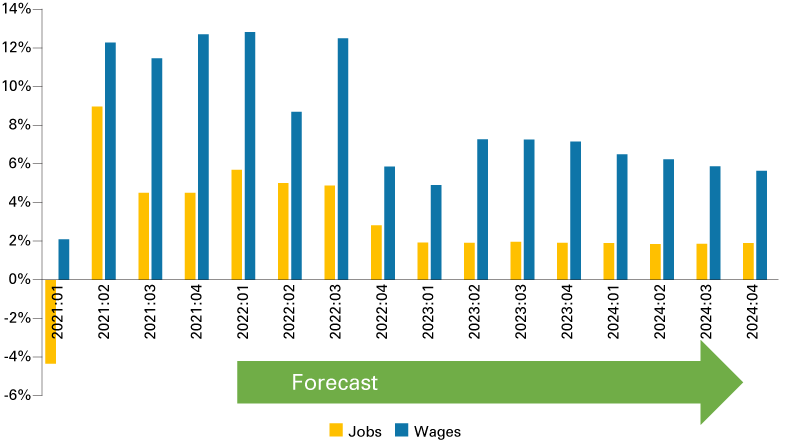
Looking at jobs, we forecast up to 78,000 jobs by the end of 2024 in the metro area. This is in stark contrast to the lows of the pandemic at the beginning of 2021 (Figure 7). Growth rates for both jobs and wages in Figure 8 show a slow-growth forecast through much of 2023 and 2024.
Figure 7: Bloomington metro payroll employment data and forecast (in thousands)
Source: Indiana University Center for Econometric Model Research
Figure 8: Year-over-year growth rates for jobs and wages data and forecast
Source: Indiana University Center for Econometric Model Research
Productivity, as measured by the Bloomington metropolitan area gross product (GDP), has grown from $5.7 billion back in the early days of the Great Recession of 2010 to $6.68 billion by 2021. Over the worst year of the pandemic (2020), Bloomington saw impressive growth of 3.8%. We forecast marginal growth for 2023, with some acceleration in 2024. Overall, our forecast is overcast by the combination of continued Federal Reserve Bank interest rate hikes and stubborn inflation, which continues to dampen consumption and increase supply costs. For a region with a strong goods-producing sector, coupled with a well-educated workforce and strong income growth, the recession, if and when it comes to Bloomington, may well be stunted in its effects.
Figure 9: Bloomington metro gross domestic product (in millions) and growth rate
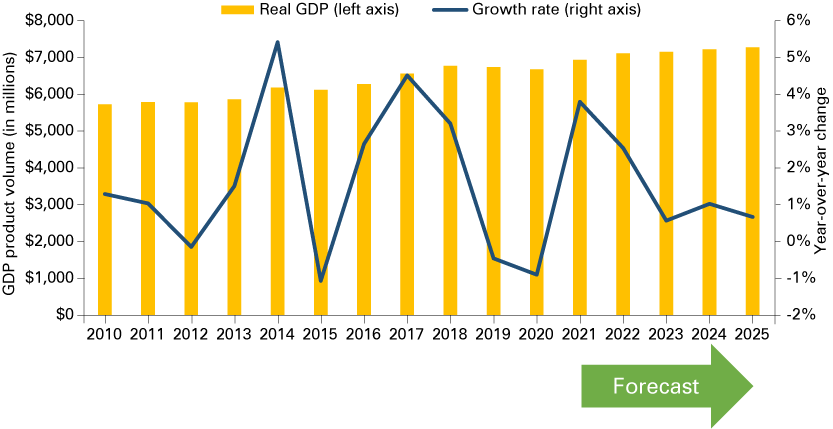
Note: Data for 2010 to 2020 are real GDP (chained millions of 2012 dollars) from the Bureau of Economic Analysis. Data for 2021 to 2025 are forecast.
Source: Indiana University Center for Econometric Model Research


