

Tracking the economy with the Brave-Butters-Kelley Indexes
Assistant Professor, Business Economics & Public Policy, Indiana University Kelley School of Business
Introduction
Gauging the current state of economic conditions and its trajectory is difficult at the best of times. Today, it is even harder.
The sorts of information we need and that are readily and frequently available—for instance, how many people filed for unemployment insurance—only provide insights about the health of one slice of the economy—such as the labor market. To make matters worse, the growing abundance of such indicators has made it difficult to know which is the most relevant.
Alternatively, other more comprehensive measures of economic activity, such as U.S. real gross domestic product (GDP), tend to have substantial time lags before they are published.
Nevertheless, policymakers and businesses require timely and accurate assessments of economic activity as they make decisions. This is especially true now as the economy continues its path out of the pandemic recession, and into unprecedented levels of both inflation and unemployment.
This article outlines a compelling set of indexes—the Brave-Butters-Kelley Indexes (BBKI)—which overcome these hurdles and already have a well-established track record of accurately identifying key turning points in economic activity. Historically, these indexes have been regularly produced by the Federal Reserve Bank of Chicago, but as of August 2022, they will now be produced by the Indiana Business Research Center (IBRC) at the IU Kelley School of Business. See the current release here.
Since this is the BBKI’s inaugural year at the IBRC, it is only natural to reintroduce the indexes to the Indiana Business Review audience. In the first part of this article, I describe the BBKI, outline how it's constructed and what makes it unique. I will also describe briefly how the BBKI can be used to make assessments on the current state of economic conditions, and how historically it has performed at identifying key turning points in the economy.
The question of whether or not the economy is currently in a recession has been thrust into the national debate recently. This debate has largely been sparked by the latest reading of real GDP growth coming in negative for the second quarter of 2022, which means there have been two consecutive quarters of declining real GDP growth. So, it seems fitting to speak directly to that debate through the lens of the BBKI.
The beginning
The Brave-Butters-Kelley Indexes are the consequence of a combined more than 20 years of work that Scott Brave, David Kelley, and I conducted as economists at the Federal Reserve Bank of Chicago during the 2010s. Initially, this work was centered on producing and conducting research on the Chicago Fed National Activity Index (CFNAI).
The CFNAI is a monthly measure of U.S. economic activity constructed from a selection of 85 macroeconomic indicators encompassing four types of variables:
- Production and income
- Employment, unemployment and hours
- Personal consumption and housing
- Sales, orders and inventories
By examining a diverse set of indicators, the CFNAI is designed to measure broad movements in economic activity. The index is measured in standard deviation units, and a zero value for the index indicates growth in economic activity is around its long-term historical average. A positive value of the index indicates that growth in economic activity is above-average growth, while a negative value of the index indicates that growth in economic activity is below average.
The CFNAI was the creation of a team of research economists led by Charles Evans—who later became and still is the president of the Federal Reserve Bank of Chicago. Interestingly, the CFNAI was originally designed as a gauge to predict future periods of inflation (Stock and Watson, 1999; Fisher, 2000). However, much of its value turns out instead to come from its ability to identify the timing of U.S. business cycles—or identifying periods of recession and expansion (Evans, Liu, Pham-Kanter, 2002; Berge and Jordà, 2011).
The evolution
Through our work on the CFNAI and the continuous research all three of us conducted during our time at the Federal Bank of Chicago, we began to explore how alternative approaches could be used to further our understanding of the current state of economic activity and where it might be heading. Most of these alternatives were centered on trying to accomplish a few objectives.
First, we realized that there were enough other indicators available that could capture aspects of economic activity that might otherwise have been missing in the CFNAI.
Second, it became clear that not having real GDP—the broadest and most comprehensive measure of economic activity—in the construction of the monthly activity index was an issue.
It was an issue for two reasons. First, it was clear that having any index of economic activity benchmarked directly to GDP was valuable. Benchmarking to real GDP meant facilitating more transparent interpretation and allowing anyone using the index to compare it to other assessments made in relation to real GDP. Second, incorporating real GDP into the construction might also alleviate the concern that trends very specific to particular industries or segments of the economy might bleed into the assessment of overall economic activity simply because they were well represented in the set of indicators used in any construction of economic activity.
In some ways, by including real GDP into the construction, it might be possible to discipline the sorts of large, still very sector-specific trends that might confuse our assessment of overall economic activity.
One of the primary hurdles with incorporating real GDP, however, is that it is a quarterly series produced with a substantial delay relative to most of the monthly indicators already used to construct the CFNAI. Part of the appeal of the monthly index is its timeliness. Thus, if real GDP was to be included, the approach would need to accommodate data that had different release frequencies (i.e., some quarterly and some monthly series).
Addressing these issues, as well as making some additional modeling decisions associated with the inclusion of real GDP into the analysis, led us to the construction of an alternative set of indexes which would become known as the Brave-Butters-Kelley Indexes (BBKI), the focus of the Economic Perspectives article “A new ‘big data’ index of U.S. economic activity” (Brave, Butters, Kelley, 2019). This set of indexes is currently constructed using a collapsed dynamic factor model using data on quarterly U.S. real GDP growth and a panel of 490 monthly time series of real economic activity since January 1960.
The construction of the Brave-Butters-Kelley Indexes
To construct the expanded set of monthly indicators, we began with the original 85 indicators used in the construction of the CFNAI and then added series which had shown to be effective at tracking the economy. In many cases, these were series used in models designed to track the economy, like the Conference Board’s coincident, leading and lagging economic indexes; Atlanta Fed’s GDPNow (Higgins, 2014); and the New York Fed Staff Nowcast model (Bok et. al., 2017). Finally, we made every effort to fill out any geographic and sectoral-level detail whenever possible using a host of databases available through Haver Analytics.
Figure 1 displays the full time series of two of the resulting indexes that comprise the BBKI: the coincident and leading indexes of economic activity. The coincident index is the most directly comparable to the CFNAI and other real activity measures of economic activity, like the Aruoba-Diebold-Scotti Business Conditions Index (Aruoba, Diebold, Scotti, 2009). The coincident index is measured in standard deviation units and is designed to assess the strength of the economy currently.
The leading index is a sub-component of the coincident index designed to isolate the strength in economic activity that tends to have historically been a leading signal of the trajectory of economic activity going forward.
Interactive Figure 1: Coincident/leading indicators
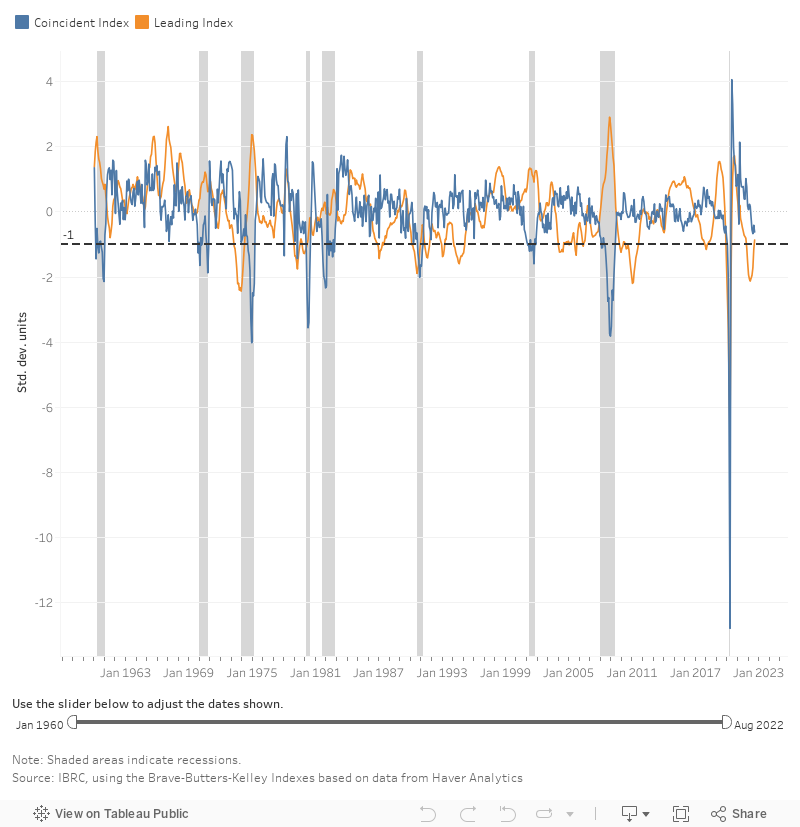
Along with both indexes, each recession—as defined by the National Bureau of Economic Research—that has occurred since 1960 has been shaded. As is evident in the figure, the coincident index has a strongly cyclical pattern, decreasing sometimes sharply during economic recessions while taking values near zero or above during economic expansions. In fact, according to my own previous research (with Brave and Kelley), using a threshold value of -1.0 together with the coincident index provides a remarkably accurate (up to 99% accurate) way to gauge whether the economy is in a recession (Brave, Butters, Kelley, 2019). This accuracy in gauging the strength of the economy has been shown to best many of the leading alternatives and can often come in a much timelier fashion given the higher frequency availability of the indexes.
The leading index is designed to be more of a barometer of where the economy might be heading in the future. This leading index has on several occasions projected a future business cycle turning point several months before a peak or trough actually occurs—historically being the most informative about six to seven months out.
A critical appeal—by design—with the BBKI are their inherent link to real GDP growth. In fact, real GDP growth is in many ways treated as a uniquely special indicator in the construction of the BBKI. This goes beyond the fact that, as a quarterly data series amongst many monthly ones, the methodology must overcome the mixed-frequency data set. GDP is also treated uniquely in the construction of the BBKI in that it is allowed to have several distinct sub-components that each have their own separate type of dynamics.
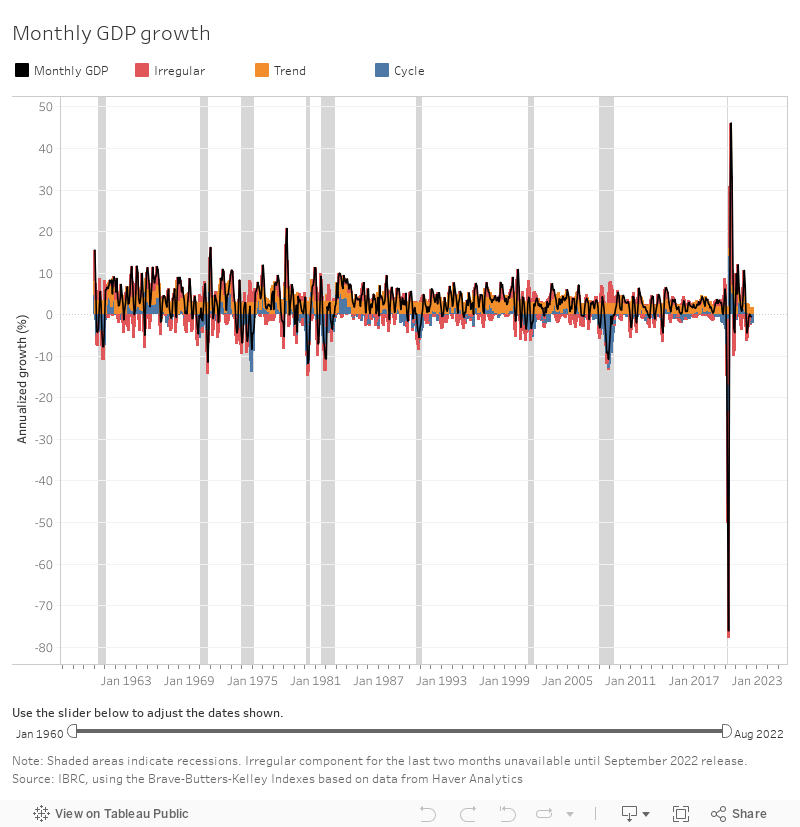
More specifically, each month real GDP growth is allowed to have three separate components that all must add up to yield the total amount of growth or contraction. The three components are: (i) the trend, (ii) the cycle and (iii) the irregular component. The trend—as the name would suggest—represents the very low-frequency and slow-moving component of real GDP growth. More simply, one can interpret the trend as the very long-run average of real GDP growth. While one would not expect this component to vary that much month to month over the last several decades, we have seen a noticeable decline in the long-run average of real GDP growth.
Next, the cycle—as it sounds—is the component of real GDP growth that reflects the business cycle. This component of real GDP growth is designed to capture if there are systematic expansions or contractions across a variety of sectors of the economy. It is this component that in many instances will be the most influential in guiding assessments about the health of the economy and public policy decisions designed to address it.
Third is the irregular component, or what remains “left over,” after accounting for the trend and cycle components, to get back to the amount of growth or contraction we observed. While the BBKI methodology is designed to have the trend and cycle components reflect movements that are likely to govern the direction of growth going forward, the irregular component is designed to reflect more “one-off” or random fluctuations that are less likely to reflect where economic activity is headed in the future.
The BBKI approach identifies each of these components by breaking down the time series of real GDP and how it relates to the large set of other economic activity indicators. Moreover, by leveraging the set of monthly indicators, it is able to construct these measures (and the aggregate) at a monthly frequency. Thus, even for the headline number of real GDP growth, the BBKI is able to provide an even finer measure than is reported by the Bureau of Economic Analysis (BEA). Figure 2 displays the full time series of these subcomponents together with the full time series of monthly GDP. It will be these sub-components that serve as the basis of my current read on economic activity and how best to answer the question: Are we or are we not currently in a recession?
Interactive Figure 2: Monthly GDP decomposition
BBKI and the big question: Are we or are we not currently in a recession?
On Friday, September 30, 2022, the BEA released their latest measures of growth in real GDP. The final estimate of real GDP growth for the second quarter of 2022 was -0.6%. This fall in real GDP comes immediately following a 1.6% decrease in real GDP growth in the first quarter of 2022.
As two consecutive quarters of falling GDP is now a well-cited “rule of thumb” for defining recessions, the national debate has intensified lately over the current state of economic activity. This, coupled with near 40-year record highs of inflation and the Federal Reserve committed to raising interest rates through the remainder of the calendar year to combat that inflation, has many economists predicting a recession within the next twelve months is increasingly likely.
While the “two consecutive negative quarters of growth” rule of thumb has been used widely, it is just that: a rule of thumb. The process by which a recession is defined (or “dated”) is governed by the National Bureau of Economic Research (NBER) and its Business Cycle Dating Committee, a group of leading academic economists. That committee notes that a recession is a “significant decline in economic activity that is spread across the economy and that lasts more than a few months.”
The committee makes their determination by examining a range of economic data including gross domestic product, employment, household income, industrial production and others. It’s the systematic and widespread downturn among all these indicators that makes the case for the start of a recession (or, that the economy has “peaked”). Asked in August about the rule of thumb, Business Cycle Dating Committee chairman Bob Hall of Stanford University stated, “That’s not anything close to the philosophy the committee brings to identifying it.”
While the NBER Business Cycle Dating Committee certainly won’t be solely basing its decision on the two consecutive declining quarters of GDP, it also tends to wait quite a while in making its determination. The NBER should not be confused with your daily weather forecaster tasked with recommending if you should bring your umbrella or wear a sweater for your upcoming commute.
The more appropriate designation would be something closer to a coroner - someone who has determined what might have caused the death many hours after it occurred and after many licensed and well-seasoned professionals made every effort to avoid that outcome. To put this metaphor into context, the NBER did not make the determination that the U.S. was in a recession during the Great Recession until a full year after it began. And it took over 15 months for it to determine that the Great Recession had ended.
Suffice it to say, the answer to the question of are we or are we not in a recession right now is unlikely to come from any rule-of-thumb nor the NBER anytime soon.
Cast against that backdrop, the usefulness of the BBKI really shines. It is a measure of economic activity that does not rely on any single measure alone—even one as important as real GDP—but instead takes an encompassing approach to measuring the state of economic activity. It also is timely and is released at a relatively high monthly frequency—a stark contrast from the sporadic and delayed announcements made by the NBER. Finally, because of its inherent connection with real GDP and understanding what is contributing to its growth or decline, the BBKI is well positioned to unpack how we might want to interpret the recent releases of GDP and what they might mean for the future trajectory of the economy.
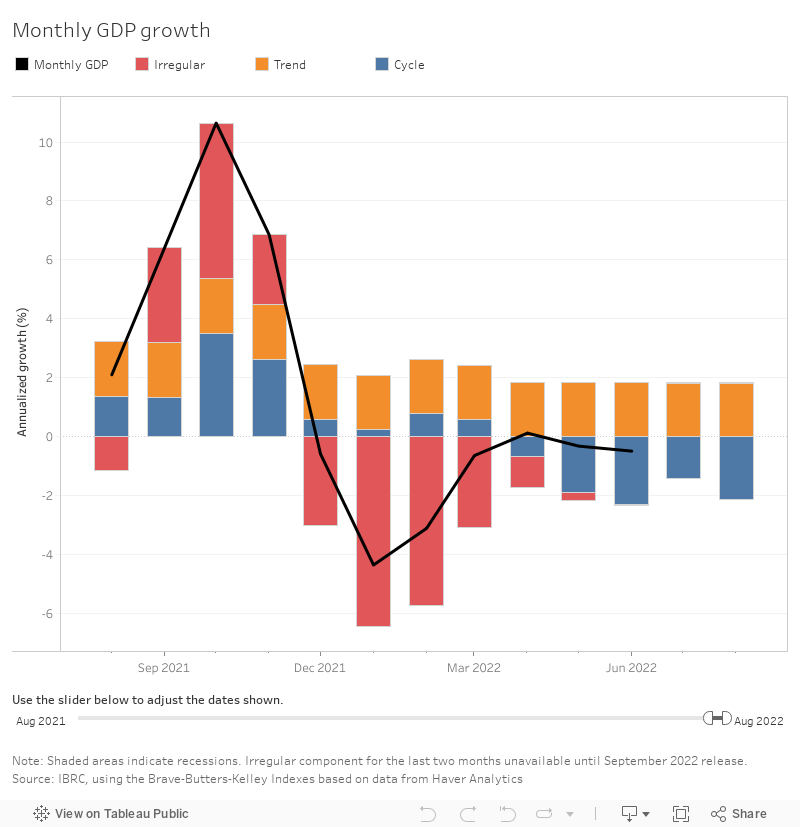
Figure 3 displays the BBKI’s decomposition of real GDP growth honing in on the most recent several quarters. Several insights about the recent trajectory of GDP growth made available by the BBKI are displayed in this figure. First, as one would have expected based off the quarterly releases, the assessment of monthly real GDP growth was negative for most of the first half of this year. With current estimates, only the month of April came in with a positive value (0.12%).
Second, the contribution to growth in real GDP across the first two quarters of this year has been quite distinct. In the first quarter of 2022—a period marked by the highest surge in the U.S. of Covid-19 cases driven by the Omicron variant—the primary driver of the contraction in real GDP growth came from the irregular component. Contrast this with the second quarter of 2022, where almost all the weakness in real GDP growth is coming from the cyclical component.
In the context of the most recent debate about whether we are in a recession or not, the fact that the BBKI decomposed the drivers of the declines in real GDP growth over the first two quarters of this year so differently is important. In many ways, the BBKI is interpreting these consecutive quarters of declining real GDP growth as two very different periods of economic activity, not a sustained weakness that has been felt systematically across the economy.
The BBKI is making this determination based off the breadth of information embedded in the 490 indicators. Plainly speaking, the data that came in during the first quarter was more mixed, and so the BBKI attributed the weakness in GDP to more of the irregular component. When the initial release of Q1 GDP came in negative, it was noted that much of the weakness stemmed from widening trade deficits and a slowdown on building up inventories, both of which appeared at the time linked to the increased strains on supply chains and operations related to the Omicron surge. In fact, consumer and business spending were expanding that quarter.
Interactive Figure 3: Monthly GDP decomposition focused on the last 12 months
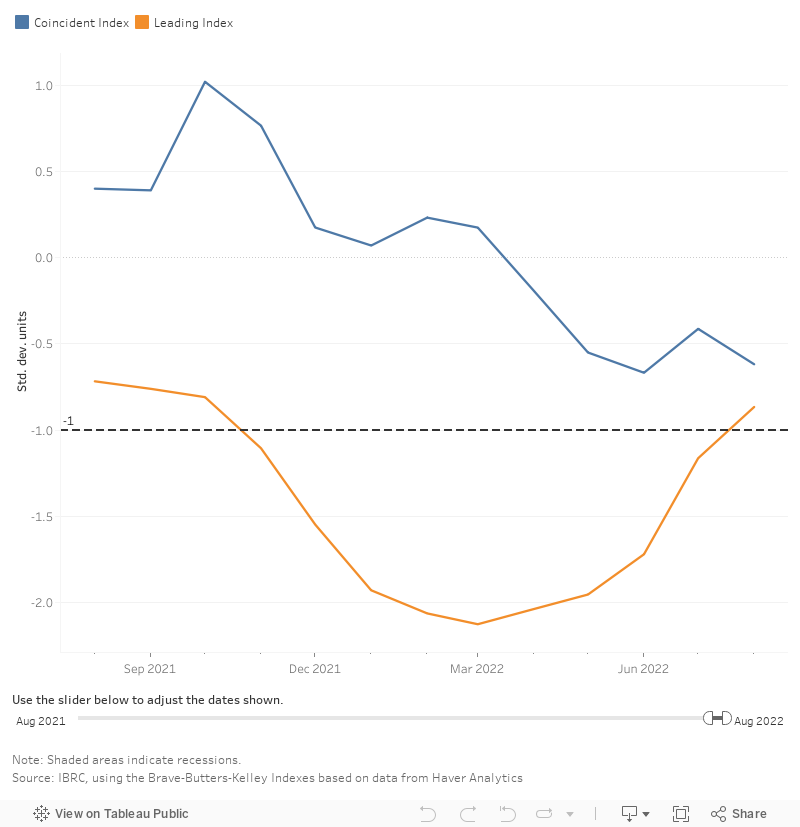
Contrast this to the BBKI’s determination of the drivers of the second quarter decline. Here, the primary driver of the decline came from the cycle component—or more specifically, the component that picks up turning points in the business cycle. In fact, the BBKI coincident index (see Figure 4), a historically accurate identifier of NBER-defined recessions, came in just above the threshold that suggests a recession has started—albeit in the second quarter, not the first. And, the readings of the coincident index for the first two months of the third quarter indicate growth in economic activity has remained below trend.
Interactive Figure 4: Coincident/leading indicators focused on the last 12 months
Conclusion
As of August 2022, the BBKI have found a new home at the IBRC at the IU Kelley School of Business and will continue to be produced on a monthly schedule going forward. This set of indexes provide a timely and highly accurate depiction of the state of economic activity for the U.S. and can be utilized to gauge the future trajectory of economic activity. Just as an example, using the resulting sub-indexes of GDP over the first part of the year indicates that while the economy contracted over the entire first half of 2022, this contraction was driven by potentially short-lived phenomena. The path over the remaining part of the year, in particular for the labor market, will be influential for economic activity going forward.
Get notified when the BBKI is released
Subscribe to receive a monthly email notification when the BBKI is updated.
References
- Aruoba, S.B., F.X. Diebold, and C. Scotti (2009). “Real-time measurement of business conditions,” Journal of Business & Economic Statistics, 27(4), pp. 471-427.
- Berge, T. J. and Ò. Jordà (2011). “Evaluating the classification of economic activity into recessions and expansions,” American Economic Journal: Macroeconomics, 3(2), pp. 246-277.
- Bok, B., D. Caratelli, D. Giannone, A. Sbordone, and A. Tambalotti (2017). “Macroeconomic nowcasting and forecasting with big data,” Federal Reserve Bank of New York, staff report, No. 830, available online: https://www.newyorkfed.org/research/staff_reports/sr830.
- Brave, S., R. A. Butters, D. Kelley (2019). “A new `big data’ index of U.S. economic activity,” Economic Perspectives, 43(1), pp. 1-30.
- Evans, C. L., C. T. Liu, and G. Pham-Kanter (2002). “The 2001 recession and the Chicago Fed National Activity Index: Identifying business cycle turning points,” Economic Perspectives, 26(3), pp. 26-43.
- Fisher, J. D. M. (2000). “Forecasting inflation with a lot of data,” Chicago Fed Letter, No. 151.
- Higgins, P. (2014). “GDPNow: A model for GDP `nowcasting,’” Federal Reserve Bank of Atlanta, Working Paper, No. 2014-7, available online: https://www.frbatlanta.org/research/publications/wp/2014/07.aspx.
- Stock, J. H. and M. W. Watson (1999). “Forecasting inflation,” Journal of Monetary Economics, 44(2), pp. 293-335.
