South Bend and Elkhart forecast 2022

Director of the Bureau of Business and Economic Research and Professor of Economics, Judd Leighton School of Business and Economics, Indiana University South Bend
In 2021, both the South Bend-Mishawaka and Elkhart-Goshen MSAs saw economic recovery, but at different paces. South Bend-Mishawaka added new jobs, although its labor force remained soft in 2021—and still significantly below the pre-pandemic level in 2019. Elkhart-Goshen, on the other hand, recovered all its lost labor force and employment eight months into 2021, and its labor force and employment were slightly above the 2019 numbers. Both areas saw a leap in their labor cost. In addition, the St. Joseph County housing market had more new single-family home construction and soaring prices for existing homes.
Labor force and employment
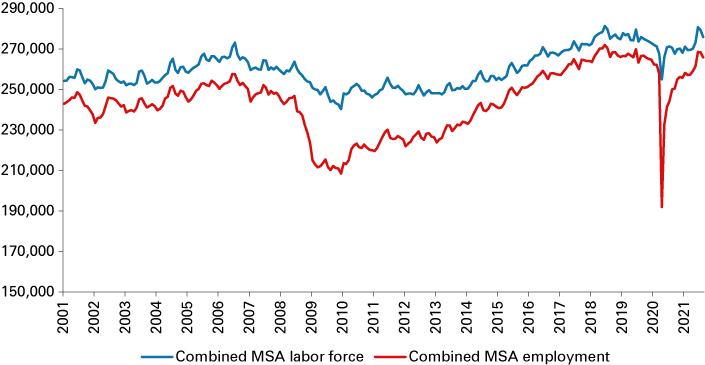
Based on the household survey from the U.S. Bureau of Labor Statistics, the combined region’s labor force gained 5,588 from 2020 and averaged 273,644 in the first eight months of 2021.1 Figure 1 illustrates the monthly trends of the labor force and employment of the combined region.2 The labor force in the South Bend MSA was similar to the 2020 level, yet was still 4,374 below the 2019 figure.3 On the other hand, Elkhart-Goshen MSA’s labor force expanded further in 2021 and reached 115,226, which was 5,757 more than the labor force in 2020 and 1,834 above the 2019 level.4
The average employment in the combined region reached 261,961 in the first eight months of 2021 and was 19,119 jobs more than one year ago (+7.9%). The South Bend-Mishawaka MSA added 6,989 jobs (+4.9%), and the Elkhart-Goshen MSA gained 12,130 jobs (+12.2%). In comparison, both MSAs outpaced the U.S. national employment growth rate, which was 3.0% in 2021. South Bend-Mishawaka’s capacity to add jobs is similar to Indiana’s rate of 4.8%. Elkhart-Goshen’s impressive job growth far surpassed the state rate of employment growth.
Figure 1: Labor force and employment in the South Bend-Mishawaka and Elkhart-Goshen MSAs combined

Note: Data are shown through August 2021 and are not seasonally adjusted.
Source: STATS Indiana, using U.S. Bureau of Labor Statistics data
Unemployment
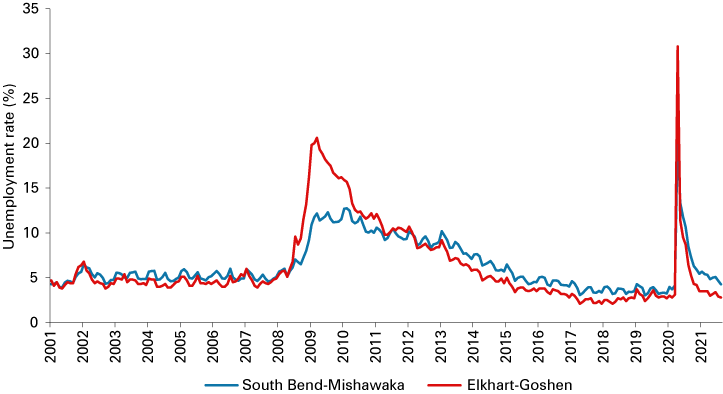
Both metropolitan areas saw declining unemployment rates in 2021. Figure 2 illustrates the South Bend-Mishawaka and Elkhart-Goshen MSAs’ unemployment rates from January 2001 to August 2021. Specifically, the January-August average unemployment rate in South Bend-Mishawaka was 5.0%, down from the 9.6% average jobless rate in 2020. However, this figure is still above the pre-pandemic rate of 3.7% in 2019. Elkhart-Goshen’s unemployment rate averaged 3.2% in 2021, much lower than its 2020 rate of unemployment (9.5%) and comparable to its pre-pandemic rate of 3.1% in 2019. Elkhart-Goshen’s unemployment rate is lower than the national (6.0%) and state (4.5%) unemployment rates. Meanwhile, South Bend-Mishawaka’s unemployment rate is about 0.5 percentage point higher than the state jobless rate and 1 percentage point below the national rate.
Figure 2: Unemployment rate in the South Bend-Mishawaka and Elkhart-Goshen MSAs

Note: Data are shown through August 2021 and are not seasonally adjusted.
Source: STATS Indiana, using U.S. Bureau of Labor Statistics data
Employment by industry
Turning to the payroll statistics of business establishments (see Table 1), total nonfarm employment in South Bend-Mishawaka added 2,063 jobs (+1.5%) and averaged 136,163 jobs in 2021.5 Yet, this number is still 9,625 below 2019 nonfarm employment. Most sectors saw job recovery, including manufacturing (+788 jobs); trade, transportation and utilities (+688 jobs); professional and business services (+113 jobs); private educational and health services (+725 jobs); and leisure and hospitality (+1,313 jobs). However, natural resources, mining and construction (-450 jobs); other services (-488 jobs); and government (-538 jobs) continued to suffer job losses.
Elkhart-Goshen’s total nonfarm employment reached 138,238 in 2021, 9.9% higher than that in 2020 and slightly above 2019’s pre-pandemic level.6 The strong recovery in Elkhart-Goshen was led by manufacturing (+11,438 jobs), followed by professional and business services (+500 jobs); trade, transportation and utilities (+488 jobs); and natural resources, mining and construction (+300 jobs). Leisure and hospitality (+188 jobs) and other services (+175 jobs) experienced smaller job additions. Lastly, job losses were observed in private educational and health services (-288 jobs); government (-263 jobs); and information (-75 jobs).
Table 1: Year-to-date employment by industry and metro area
| Industry | South Bend-Mishawaka | Elkhart-Goshen | ||
|---|---|---|---|---|
| Employment in 2021 | Change since 2020 | Employment in 2021 | Change since 2020 | |
| Total nonfarm | 136,163 | 2,063 | 138,238 | 12,463 |
| Natural resources, mining and construction | 5,175 | -450 | 4,275 | 300 |
| Manufacturing | 16,400 | 788 | 70,650 | 11,438 |
| Trade, transportation and utilities | 25,313 | 688 | 19,750 | 488 |
| Information | 1,200 | -50 | 300 | -75 |
| Financial activities | 5,838 | -38 | 3,100 | 0 |
| Professional and business services | 13,525 | 113 | 9,613 | 500 |
| Private educational and health services | 36,425 | 725 | 11,300 | -288 |
| Leisure and hospitality | 13,538 | 1,313 | 6,763 | 188 |
| Other services | 4,725 | -488 | 4,325 | 175 |
| Government (includes public schools and hospitals) | 14,025 | -538 | 8,163 | -263 |
Note: Data are for January through August 2021.
Source: STATS Indiana, using Current Employment Statistics (CES) data from the U.S. Bureau of Labor Statistics
Local wages and hours worked
In 2021, labor costs continued to trend up in both MSAs. Average hourly earnings for private sectors rose 6.1% to $26.40 in South Bend-Mishawaka and 7.5% to $25.76 in Elkhart-Goshen. The average workweek for all employees shrank by 1.0% to 34.8 hours in South Bend-Mishawaka and 0.7% to 36.24 hours in Elkhart-Goshen. Consequently, the average weekly earnings were $919.1 (+5.1%) in South Bend-Mishawaka and $933.6 (+6.8%) in Elkhart-Goshen.
Housing
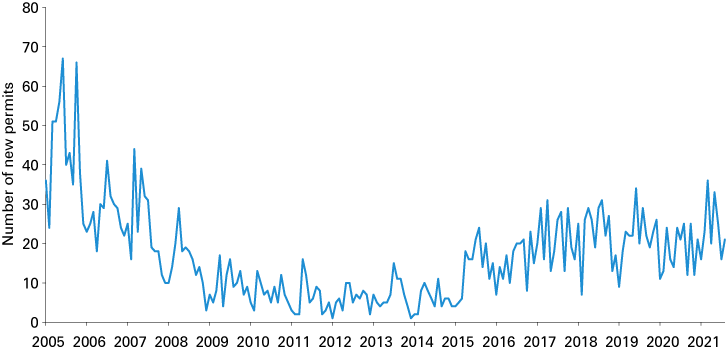
The local housing market had a prosperous year in 2021. First, new home construction picked up the pace in St. Joseph County in 2021. Figure 3 displays the single-family residential building permits issued in St. Joseph County from January 2005 to August 2021. The county issued 190 new single-family building permits from January to August, which was 28.4% higher than that in 2020. This year’s new building permits were even greater than the pre-pandemic level of 177 building permits in 2019. Second, additional statistics from the Indiana Association of Realtors showed that new listings of houses in St. Joseph County increased by 6.2% and closed sales were 9.8% higher in January-August 2021.7 Median sales price soared 11.0% in 2021, the most significant increase since 2009.
Figure 3: Single-family residential building permits in St. Joseph County

Note: Data are shown through August 2021.
Source: St. Joseph County Building Department
Summary
As the COVID-19 vaccination program continued to roll out in 2021 and the economy bounced back from the sudden and damaging pandemic shock, the suppressed consumer demand during the lockdown was released. This powered a substantial uplift for the local economy. Specifically, South Bend-Mishawaka MSA’s unemployment rate was 20.7% in April 2020, dropped substantially to 4.8% in April 2021, and further declined to 4.3% in August 2021. Similarly, Elkhart-Goshen MSA’s unemployment rate also went from a historic high of 30.8% in April 2020 to 3.0% in a year and further down to 2.8% by August 2021, which is below the 3.0% pre-pandemic unemployment rate in August 2019 (which is especially significant since its labor force is also larger).
Looking ahead into 2022, there are mixed positive and negative factors that would impact local job markets.
The U.S. economic fundamentals remain strong, with The Conference Board predicting the U.S. economy will grow by 3.8% in 2022 and 3.0% in 2023.8 Consumers have accumulated excess savings during the pandemic period, and thanks to the financial market, many households’ finances are in good shape. That would be continuing support for solid consumer spending in durable goods, leisure and hospitality, and personal care in 2022. In addition, the passing of the infrastructure bill in Congress to fund roads and highways, bridges, broadband development, and airport projects,9 should support the economy in the short term and foster even greater productivity growth in the long run.
There will be more job opportunities in the local labor market due to the strong consumer demand and government spending in the next year. However, whether the unemployment rate will go down also depends on the labor supply. Unfortunately, South Bend-Mishawaka and Elkhart-Goshen are experiencing a labor shortage—a nationwide problem.
Demographic change is a possible contributor to the labor shortage. With the retirement of baby boomers, working-age population growth is slowing or even shrinking. For example, South Bend-Mishawaka’s share of population ages 18-64 was 60.1% in 2020, about 2 percentage points less than 10 years ago. Elkhart-Goshen saw a similar trend, with its share of population ages 18-64 declining from 60.3% in 2010 to 57.3% in 2020. In addition, the rising share of senior citizens ages 65 and above in the local labor force has been a trend.10 However, the pandemic poses a significant threat to the health of older workers. The fears over health and the need to care for young grandchildren when day cares and schools were closed forced more senior workers to leave the labor force. Thirdly, the pandemic has changed workers’ mentality, leading workers to reassess their work environment and has resulted in many resignations. These factors could be bottlenecks for the further expansion of the local labor force and lower unemployment rates.
In 2022, the local labor markets will continue to be tight, incentivizing employers to increase workers’ compensations to meet higher consumer demand. We hope that the global supply chain disruption will be resolved in the near future, as the COVID-19 vaccines are given out globally and effective COVID-19 treatments become available. That would help bring down the rising inflation rate due to insufficient supply and increase households’ real disposable income.
In sum, South Bend-Mishawaka MSA’s labor force is expected to expand, and more jobs will be added in 2022, both of which will bring its unemployment rate to around 4.0%. At the time of this writing, Elkhart-Goshen MSA’s unemployment rate for August 2021 was a very low 2.8%, indicating the area is reaching the full employment level. Hence, further improvement in this area’s labor market could be smaller. The unemployment rate of Elkhart-Goshen in 2022 is anticipated to be around 3.0% with seasonal fluctuations. The personal income in both areas is predicted to increase in 2022. The housing market boom will likely slow down next year. On the one hand, higher personal incomes and the lingering impact of coronavirus and its variants give rise to greater demand for single-family houses. On the other hand, rising interest rates and the already high housing prices could taper prospective buyers’ desire to enter the housing market.
Notes
- The labor statistics used in the article, including labor force, employment, unemployment, unemployment rate, employment and earnings by industries, are the average of January to August in 2021.
- Labor force and employment data are available at STATS Indiana: www.stats.indiana.edu/laus/laus_view3.html.
- The average labor force in South Bend MSA was 158,418 in 2021, 158,587 in 2020 and 162,792 in 2019.
- The average labor force in Elkhart-Goshen MSA was 109,469 in 2020 and 113,392 in 2019.
- Data come from the Current Employment Statistics (CES) of the U.S. Bureau of Labor Statistics. In 2020, the average total nonfarm employment for South Bend-Mishawaka in the first eight months was 134,100.
- Elkhart-Goshen MSA’s total nonfarm employment was 125,775 in 2020 and 137,975 in 2019.
- Source: Indiana Housing Market Update, August 2021.
- “The Conference Board economic forecast for the U.S. economy,” The Conference Board, October 13, 2021, www.conference-board.org/research/us-forecast
- Ewan Quayle, “Infrastructure bill live updates: Democrats return to capitol for showdown over multi-trillion dollar funding packages,” Newsweek, October 19, 2021, www.newsweek.com/infrastructure-bill-democrats-vote-live-updates-1639738
- According to the U.S. Bureau of Labor Statistics (BLS), the labor force participation rate is expected to increase fastest for the oldest segments of the population—most notably, people ages 65 to 74 and 75 and older—through 2024. In contrast, participation rates for most other age groups in the labor force are not projected to change much over the 2014–2024 decade. See Mitra Toossi and Elka Torpey, “Older workers: Labor force trends and career options,” U.S. Bureau of Labor Statistics Career Outlook, May 2017, www.bls.gov/careeroutlook/2017/article/older-workers.htm


