Richmond forecast 2022

Director of the Business and Economic Research Center and Associate Professor of Finance, Indiana University East
Wayne County, the home of Richmond on the eastern side of Indiana, is home to more than 65,000 residents and a labor force of 30,000. It provides nearly 40,000 jobs for workers in and outside Wayne County. Its largest industry is health care, with 6,438 jobs, followed by manufacturing, with 6,076 jobs. Like most counties in the state, Wayne County’s unemployment rate is well below 5% and stood at 3.7% in September, well below its 6.5% rate in September 2020.
Here we will describe the performance of key components of Wayne County, the regional economy and our outlook for 2022.
Income
Both total personal income of Wayne County and the region1 continued to increase in 2019 (see Figure 1). The region’s total personal income showed a greater increase in 2019 than in recent previous years. This illustrates a persistent improvement in the economic activity and living standard in the county and the continual improvement of the region by much more than would have been predicted by the trend line. Wayne County’s total personal income was $2.8 billion in 2019 (ranking 26th among Indiana’s 92 counties), up 3.1% from 2018.
Figure 1: Region and Wayne County’s total personal income
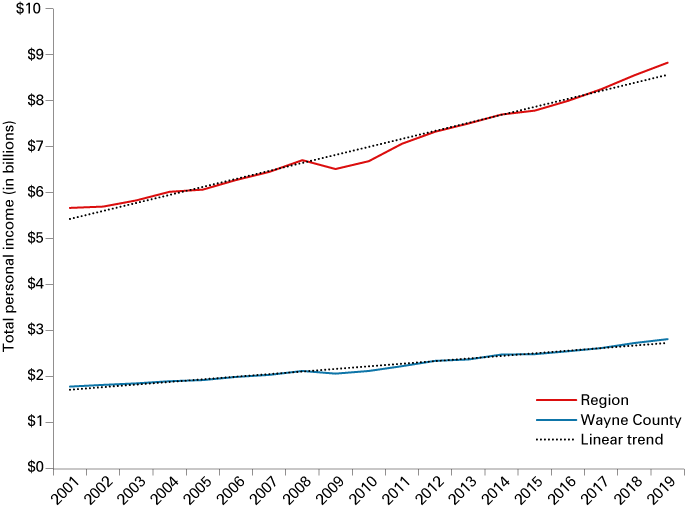
Note: Wayne County had approximately 32% of the region’s income and 31.7% of its population based on the 2019 data.
Source: Bureau of Economic Analysis (BEA) Regional Fact Sheets
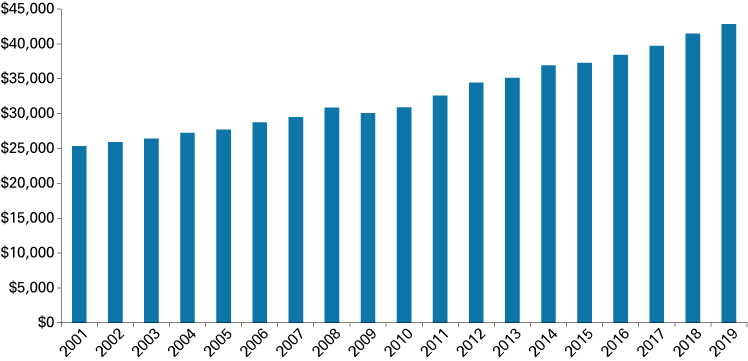
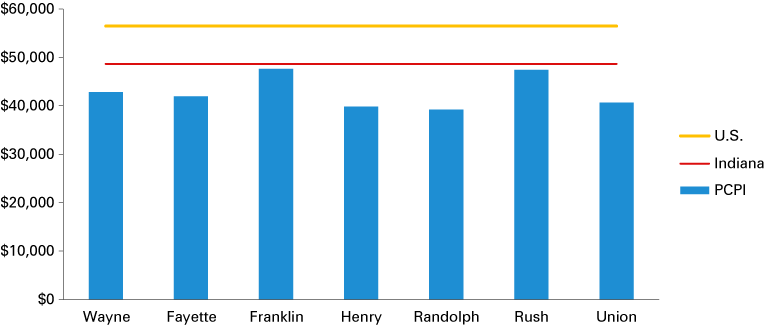
Wayne County had a per capita personal income (PCPI) of $42,857 in 2019, up from 2018 by 3.4% (see Figure 2). This was 88% of Indiana’s PCPI ($48,678) and 76% of U.S. PCPI ($56,490).
Figure 2: Wayne County’s annual per capita personal income
Source: U.S. Bureau of Economic Analysis (BEA) Regional Fact Sheets
Wayne County’s PCPI—ranked 50th among Indiana’s 92 counties—continued to lag behind Franklin County ($47,664, 17th) and Rush County ($47,445, 19th), which were the only two counties close to the state PCPI. The other counties in the region were significantly behind by over 10% (see Figure 3).
Figure 3: County-level per capita personal income, 2019
Source: U.S. Bureau of Economic Analysis (BEA) Regional Fact Sheets
Labor market
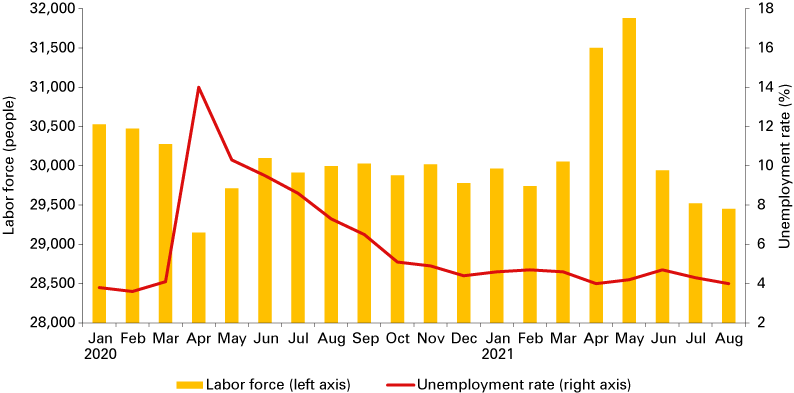
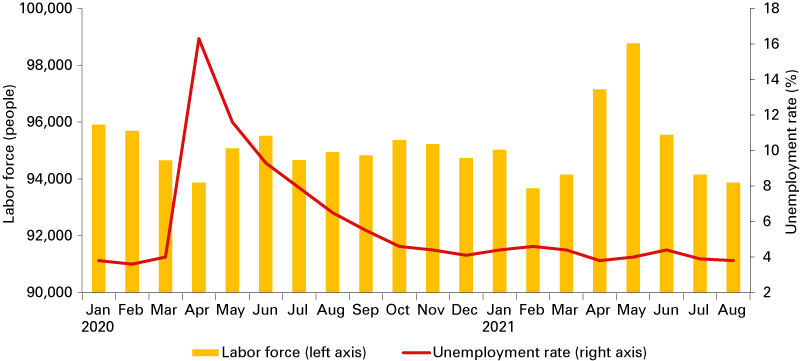
Wayne County’s labor force included 29,451 people in August 2021, representing 31.4% of the region’s total labor force of 93,865 people (see Figure 4 and Figure 5). The county had a January-August monthly labor force of 30,258 people in 2021, up by 0.8% from that of 2020. The region’s January-August monthly labor force (95,290 people) increased at a lower rate of 0.3%.
Figure 4: Wayne County’s labor force and unemployment rate
Note: Data are not seasonally adjusted.
Source: Local Area Unemployment Statistics (LAUS) from the U.S. Bureau of Labor Statistics.
Wayne County’s January-August monthly unemployment rate was 4.4% in 2021, down by 3.3 percentage points from that of 2020. The region’s same-period unemployment was 4.2%, down by 3.7 percentage points from that of 2020 (see Figure 5).
Figure 5: Region’s labor force and unemployment rate
Note: Data are not seasonally adjusted.
Source: Local Area Unemployment Statistics (LAUS) from the U.S. Bureau of Labor Statistics
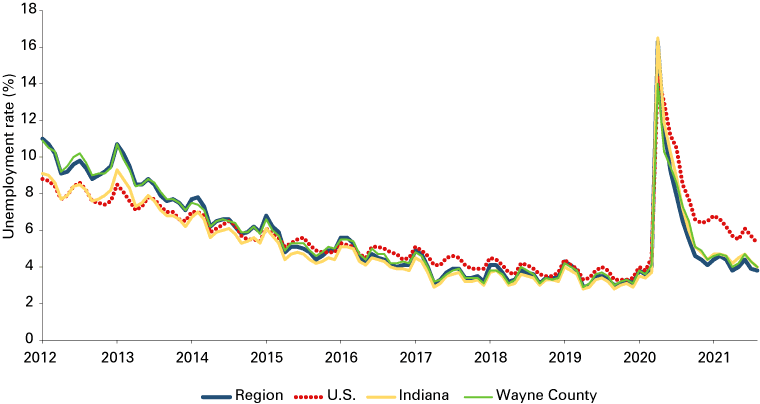
Wayne County’s January-August average unemployment rate was about the same as the region and Indiana (4.5%) and better than the U.S. average of 6.0% (see Figure 6).
Figure 6: Unemployment rate comparison
Note: Data are shown through August 2021 and are not seasonally adjusted.
Source: Local Area Unemployment Statistics (LAUS) from the U.S. Bureau of Labor Statistics
Jobs and wages
Wayne County’s private sector lost 1,135 jobs in the first quarter of 2021 relative to 2020 (see Table 1). These losses accounted for over 60% of the total private job loss in the region (-1,810 jobs).
The job loss in manufacturing (-531 jobs) in Wayne County contributed to about half of the county’s private sector job loss. Other hard-hit sectors included retail trade; accommodation and food services; and administrative, support, waste management and remediation. Sectors with smaller, double-digit job losses were wholesale trade; finance and insurance; arts, entertainment and recreation; and information. The one-year change shows that the industry sectors in Wayne County were either maintaining about the same size or shrinking. Although three sectors gained jobs (utilities: 3.9%; educational services: 3.6%; and health care and social services: 0.3%), that growth could hardly be considered significant expansions.
The one-year change (estimated with public data subject to disclosure issues for some sectors) illustrates several sectors in the region with large job gains over 2020: professional, scientific and technical; management of companies and enterprises; administrative, support, waste management and remediation; and construction.
Table 1: Employment by industry
| NAICS classification | Wayne County | Region | Indiana | |||
|---|---|---|---|---|---|---|
| 2021 Q1 | One-year change | 2021 Q1 | One-year change | 2021 Q1 | One-year change | |
| Total private | 24,323 | -1,135 | 51,739 | -1,810 | 2,559,637 | -76,768 |
| Manufacturing | 5,315 | -531 | 12,610 | -1,071 | 522,217 | -12,838 |
| Retail trade | 3,417 | -223 | 7,577 | -234 | 309,653 | 461 |
| Transportation and warehousing | 701 | -2 | 1,033(D) | -214 (ED) | 151,179 | 10,647 |
| Agriculture, forestry, fishing and hunting | 228 | -1 | 273(D) | -2(ED) | 14,747 | -9 |
| Mining | 19 | -3 | 35(D) | -6(ED) | 4,494 | -1,023 |
| Utilities | 53 | 2 | 115(D) | -55(ED) | 13,651 | -278 |
| Construction | 764 | -3 | 2,621 | 190 | 137,016 | -2,436 |
| Wholesale trade | 664 | -57 | 1,522(D) | -115(ED) | 119,561 | -2,363 |
| Information | 166 | -19 | 369(D) | -76(ED) | 25,352 | -2,890 |
| Finance and insurance | 796 | -45 | 1,586(D) | -29(ED) | 99,481 | 660 |
| Real estate and rental and leasing | 132 | -8 | 331 | -19 | 34,251 | -1,565 |
| Professional, scientific and technical | 486 | n/a | 987(D) | 569(ED) | 127,429 | 1,506 |
| Management of companies and enterprises | 307 | n/a | 361(D) | 308(ED) | 33,089 | -1,788 |
| Administrative, support, waste management and remediation | 1,318 | -108 | 2,582 | 192(ED) | 172,882 | -1,852 |
| Educational services | 609 | 21 | 628(D) | 15(ED) | 47,173 | -3,690 |
| Health care and social services | 5,965 | 17 | 7,124(D) | -34(ED) | 406,481 | -10,600 |
| Arts, entertainment and recreation | 101 | -25 | 225(D) | -46(ED) | 29,956 | -8,261 |
| Accommodation and food services | 2,648 | -212 | 5,308(D) | -452(ED) | 229,688 | -33,332 |
| Other services (except public administration) | 633 | -26 | 1,489(D) | -54(ED) | 81,338 | -7,115 |
Notes: n/a stands for not available due to data unavailability for 2020 Q1. (D) indicates data with one or more counties excluded due to disclosure issues, and (ED) indicates an estimate made based on such data for 2020 Q1 and/or 2021 Q1.
Source: Quarterly Census of Employment and Wages (QCEW) data from the U.S. Bureau of Labor Statistics, downloaded via Hoosier by the Numbers
The average weekly wage for all private sector jobs remained about the same in Wayne County, with a 0.8% increase. The region experienced a 0.7% increase in the first quarter of 2021 (see Table 2). In Wayne County, the arts, entertainment and recreation sector, with an 18.3% wage gain over 2020, led in the growth in weekly wages. Education services suffered a tremendous drop in weekly wages (-18.9%).
Table 2: Average weekly wage by industry
| NAICS classification | Wayne County | Region | Indiana | |||
|---|---|---|---|---|---|---|
| 2021 Q1 | One-year change | 2021 Q1 | One-year change | 2021 Q1 | One-year change | |
| Total private | $792 | 0.8% | $765 | 0.7% | $1,035 | 3.4% |
| Manufacturing | $990 | 4.4% | $985 | 1.5% | $1,372 | 0.8% |
| Retail trade | $532 | 8.6% | $513 | 4.5% | $599 | 5.1% |
| Transportation and warehousing | $911 | -6.8% | $875(D) | -6.6%(ED) | $892 | -1.7% |
| Agriculture, forestry, fishing and hunting | $781 | 2.8% | $752(D) | 3.4%(ED) | $785 | -0.4% |
| Mining | $769 | 3.4% | $717(D) | 4.2%(ED) | $1,372 | 1.0% |
| Utilities | $2,561 | -4.5% | $1,936(D) | -5.2%(ED) | $2,074 | -4.0% |
| Construction | $803 | -3.5% | $880 | 3.7% | $1,158 | 3.5% |
| Wholesale trade | $1,091 | 1.3% | $938(D) | -0.7%(ED) | $1,456 | 2.4% |
| Information | $814 | -0.6% | $749(D) | 6.5%(ED) | $1,374 | 10.5% |
| Finance and insurance | $1,194 | 2.8% | $1,170(D) | 5.7%(ED) | $1,848 | 6.0% |
| Real estate and rental and leasing | $642 | 4.7% | $603 | 2.9% | $1,009 | 3.0% |
| Professional, scientific and technical | $931 | n/a | $843(D) | 13.0%(ED) | $1,405 | 2.2% |
| Management of companies and enterprises | $1,535 | n/a | $1,447(D) | 23.7%(ED) | $2,548 | 9.7% |
| Administrative, support, waste management and remediation |
$561 | 7.5% | $626 | -1.7%(ED) | $711 | 6.1% |
| Educational services | $604 | -18.9% | $591(D) | -18.1%(ED) | $826 | 5.5% |
| Health care and social services | $919 | -5.2% | $936(D) | -4.8%(ED) | $982 | 1.4% |
| Arts, entertainment and recreation | $375 | 18.3% | $412(D) | 8.1%(ED) | $725 | 2.5% |
| Accommodation and food services | $310 | 4.4% | $295(D) | 5.0%(ED) | $342 | 3.3% |
| Other services (except public administration) | $517 | 3.4% | $487(D) | 3.8%(ED) | $681 | 4.9% |
Notes: n/a stands for not available due to data unavailability for 2020 Q1. (D) indicates data with one or more counties excluded due to disclosure issues and (ED) indicates an estimate made based on such data for 2020 Q1 and/or 2021 Q1.
Source: Quarterly Census of Employment and Wages (QCEW) data from the U.S. Bureau of Labor Statistics, downloaded via Hoosier by the Numbers
Housing market
In Wayne County, home sales (653 homes) increased by the highest percentage (13.4%) and median sale price ($115,000) increased by the lowest percentage (4.5%) among all the counties in the region (excluding Union County, which declined on both measures) when comparing January-August 2021 to the same period in 2020 (see Table 3). This pattern was very different compared to overall Indiana home sales and median sale prices, which grew by 6.1% and 14.3%, respectively.
Table 3: Year-to-date housing market update
| Closed sales | Median price | |||||
|---|---|---|---|---|---|---|
| 2020 | 2021 | 2021 change | 2020 | 2021 | 2021 change | |
| Indiana | 60,183 | 63,850 | 6.1% | $182,000 | $208,000 | 14.3% |
| Fayette County | 97 | 96 | -1.0% | $71,500 | $95,000 | 32.9% |
| Franklin County | 164 | 137 | -16.5% | $155,500 | $228,500 | 46.9% |
| Henry County | 303 | 322 | 6.3% | $93,750 | $115,250 | 22.9% |
| Randolph County | 174 | 129 | -25.9% | $82,250 | $94,900 | 15.4% |
| Rush County | 1 | 1 | 0.0% | $117,900 | $165,000 | 39.9% |
| Union County | 10 | 7 | -30.0% | $114,250 | $89,900 | -21.3% |
| Wayne County | 576 | 653 | 13.4% | $110,000 | $115,000 | 4.5% |
Note: Year-to-date data (including detached single-family homes, condos and townhomes) reflect January through August data.
Source: Indiana Real Estate Markets Report by the Indiana Association of Realtors
So, what contributed to these housing market conditions? Some of the contributing factors include:
- Short supply of homes exacerbated by lack of builders2
- Lack of materials due to supply chain issues
- Skyrocketing home prices3
- Tightening home supply due to the purchases by millennials4
- Low mortgage rates earlier in the year increased demand5
- Remote work enabled people to relocate
- Buying mortgage-backed securities by federal government6
Tracie Robinson of the region’s Better Homes and Gardens First Realty Group confirmed those reasons and added, “Because more people are working from home, they found they needed a larger home or a home with a different floor plan to accommodate a home office, while some people had more cash for down payments due to the stimulus checks that they received.” She also stated that inventory still remained low in the area, with more buyers than homes available in the market. Sellers were hesitant to list their homes out of fear of not being able to obtain a suitable home replacement.
Most of the region’s counties recorded significant to tremendous growth in the median home price, from 15.4% for Randolph County to 46.9% for Franklin County. Only Henry County (6.3%), in addition to Wayne County in the region, had sold more homes in 2021 than in 2020 for the January-August period.
Outlook
The composite IU East Regional Business Confidence Index was up by 2.5%, rising to 91.9 points in 2021 (see Table 4). Both sub-indexes also increased: the Present Situation Index went up significantly by 6.4%, to 85.7 points. However, the Expectation Index went up only slightly, by 1.0% to 96.4 points. These numbers suggest that the businesses in the region experienced a much better 2021 than they had in 2020. Businesses were also looking forward to a slightly better 2022.
Table 4: IU East Regional Business Confidence Index and its sub-indexes
| 2020 | 2021 | 2020 | 2021 | ||
|---|---|---|---|---|---|
| IU East Regional Business Confidence Index value |
89.7 | 91.9 | IU East Regional Business Confidence Index score |
2,168 | 2,222 |
| Annual change | 2.5% | ||||
| Present Situation Index value | 80.5 | 85.7 | Present Situation Index score | 844 | 898 |
| Annual change | 6.4% | ||||
| Expectation Index value | 95.4 | 96.4 | Expectation Index score | 981 | 991 |
| Annual change | 1.0% | ||||
Source: The 2021 East-Central Indiana Business Survey, conducted by IU East Business and Economic Research Center, September-October 2021
Close to 60% of surveyed businesses increased their production/business activity in 2021 as compared with the year before (see Table 5). On the other hand, less than one-fifth had declined. While about 60% of surveyed businesses hired the same number of employees, only about one-fifth of them enlarged their employee pools, and the other one-fifth compressed their employment level.
More than half of the businesses maintained their capital investments at the same level as 2020. Only one-tenth of them reduced their capital investments. More than 80% of the survey participants found that their firm’s cost of doing business had increased in 2021 from 2020. About 40% of businesses were able to increase their profitability, with another 28% reporting they had seen a decline.
Table 5: Compared to the same period last year, how has each of the following changed for your business/company?
| Answer options | Has increased significantly (>5%) | Has increased slightly (<5%) | Has remained about the same | Has decreased slightly (<5%) | Has decreased significantly (>5%) | Response count |
|---|---|---|---|---|---|---|
| Production/business activity | 37.0% | 21.2% | 24.7% | 13.0% | 4.1% | 146 |
| Number of employees | 7.8% | 12.8% | 58.9% | 15.6% | 5.0% | 141 |
| Capital investment | 11.4% | 25.7% | 52.9% | 5.7% | 4.3% | 140 |
| Cost of doing business | 45.1% | 39.6% | 12.5% | 2.8% | 0.0% | 144 |
| Profitability | 13.5% | 26.2% | 31.9% | 19.9% | 8.5% | 141 |
Source: The 2021 East-Central Indiana Business Survey, conducted by IU East Business and Economic Research Center, September-October 2021
When considering expectations for 2022 compared with this year, over 90% of survey participants expected their firms to either increase or maintain the same level of production/business activity (see Table 6). While over half of the businesses anticipated hiring the same number of employees, more than a third of them would expect to add more employees and less than one-tenth had plans to cut their employment level for next year. A similar distribution was anticipated in their capital investment as well.
On the other hand, over three quarters of the survey participants expected an increase in their firms’ costs in 2022, while only 3.5% expected slightly lower costs next year. Close to half were hoping to raise their profitability, whereas more than one-third of them anticipated at least maintaining it at the same level as 2021 next year.
Table 6: How do you anticipate each of the following will change next year for your business/company as compared with this year?
| Answer options | Will increase significantly (>5%) | Will increase slightly (<5%) | Will remain about the same | Will decrease slightly (<5%) | Will decrease significantly (>5%) | Response count |
|---|---|---|---|---|---|---|
| Production/business activity | 23.3% | 41.8% | 26.7% | 6.8% | 1.4% | 146 |
| Number of employees | 5.6% | 31.9% | 55.6% | 6.3% | 0.7% | 144 |
| Capital investment | 9.8% | 26.6% | 55.2% | 7.0% | 1.4% | 143 |
| Cost of doing business | 30.6% | 45.1% | 20.8% | 3.5% | 0.0% | 144 |
| Profitability | 10.4% | 37.5% | 35.4% | 14.6% | 2.1% | 144 |
Source: The 2021 East-Central Indiana Business Survey, conducted by IU East Business and Economic Research Center, September-October 2021
While a quarter of the surveyed businesses anticipated the same business and economic conditions in 2022, more than half of them were optimistic, whereas one-fifth were pessimistic about the conditions in 2022 (see Table 7).
Table 7: How do you project the overall business and economic conditions in 2022 in your area?
| Answer option | Response percent | Response count |
|---|---|---|
| Strongly optimistic | 5.5% | 8 |
| Moderately optimistic | 48.6% | 71 |
| About the same | 25.3% | 37 |
| Moderately pessimistic | 17.1% | 25 |
| Strongly pessimistic | 3.4% | 5 |
| Total | 100.0% | 146 |
Source: The 2021 East-Central Indiana Business Survey, conducted by IU East Business and Economic Research Center, September-October 2021
Taking into consideration the supply-chain bottlenecks, tight labor markets and rises in COVID-19’s delta variant cases, economists (including the Federal Reserve Bank), revised their national projections for both 2021 and 2022.7, 8 During the September Federal Open Market Committee (FOMC) meeting, the Fed’s forecasts were:
- Real GDP growth rate median: 5.9% for 2021 and 3.8% for 2022
- Unemployment rate median: 4.8% for 2021 and 3.8% for 2022
- Inflation rate median: 4.2% for 2021 and 2.2% for 2022.9
The Fed’s 2021 real GDP growth projection was about the same as the projection made by the International Monetary Fund (IMF) in October (6.0%).10 However, the Fed’s 2022 real GDP projection (3.8%) was much lower than that of the IMF (5.2%).
Summary
Businesses, having dealt with the pandemic for more than a year, continue to adapt to the new normal and have built into their practices a variety of measures to cope with the disruptions caused by the pandemic and its resulting effects on the economy. As a result, we project the unemployment rate for the region will remain relatively low, at around 4% through 2022.
Notes
- The Richmond region includes seven east-central Indiana counties: Fayette, Franklin, Henry, Randolph, Rush, Union and Wayne.
- Keith Roysdon, “Indiana’s housing market is ‘wild’,” Star Press, August 15, 2021.
- James Briggs, “‘Peak insanity’: Housing will get less weird,” Indianapolis Star, May 30, 2021.
- Alexandria Burris, “Millennials feel shut out during house hunt,” Indianapolis Star, May 16, 2021.
- Lyn Cheang Ko, “Central Indiana home sales ease,” Indianapolis Star, October 17, 2021.
- See note 2.
- Eric Morath and Theo Francis, “The U.S. expected an economic takeoff. It got a September slowdown,” Wall Street Journal, September 7, 2021.
- Gwynn Guilford and Anthony DeBarros, “Supply-chain bottlenecks, elevated inflation to last well into next year, survey finds,” Wall Street Journal, October 17, 2021.
- Federal Open Market Committee, “Summary of economic projections,” September 22, 2021.
- International Monetary Fund, “World economic outlook: Recovery during a pandemic,” October 2021.
Acknowledgements
The author deeply appreciates the feedback/support from Dr. Litao Zhong and Dean Denise S. Smith of the School of Business and Economics, Indiana University East. Thanks also go to Tracie Robinson, Broker Associate/Sales Manager of Better Homes and Gardens First Realty Group, for providing the professional insights about the housing markets in the region.


