
Kokomo forecast 2022

Professor of Economics, School of Business, Indiana University Kokomo
This article, which is part of an annual series, overviews the well-being of the 14-county service region for Indiana University Kokomo.1 In doing so, it examines several statistics that are key to providing insight into the health of the regional economy. As home to IU Kokomo, and one of the largest cities in the region, there is greater emphasis placed on the city of Kokomo and Howard County—with the understanding that many of the same issues facing Howard County are not unique within the service region.
Central and north-central Indiana continues to find the economy driven by two major sectors. Like much of the state of Indiana, the region is heavily dependent on manufacturing. Given an abundance of farmland, the agriculture sector (and primarily crop production) also plays a significant role.
In terms of manufacturing, roughly one-third of the region’s economy depends on it. This dependence is seen both in terms of the level of productivity, but also the level of employment the manufacturing sector is responsible for. Roughly one-third of the region’s employment and productivity can be found in the manufacturing sector. Within the sector, the largest level of productivity originates in the production of automobiles and within that industry’s supply chain.
A look at any map reveals only a small portion of the 14-county region is comprised of cities and towns. Between these communities, however, exists vast swaths of fertile soil, ideal for producing agricultural products. Thus, it is hardly surprising that agriculture plays such a vital role within the region. While much of the region’s rural areas are committed to growing crops, one would be remiss to ignore the important role raising livestock and the requisite processing facilities play. The level of employment in the agricultural sector wanes in comparison to manufacturing. Nonetheless, the region’s agricultural production meets not just the needs of the region, but also other parts of the country and many countries around the globe. The ability to meet such needs, however, is highly dependent on growing conditions that are subject to wide yearly fluctuations. In this article, we provide a statewide review of planted and harvested acreage, crop yields, total production, and crop prices per bushel for corn and soybeans. (At this time, the U.S. Department of Agriculture monthly report does not include county-level data.) In terms of livestock, this article focuses on hog production.
Unemployment
While 2020 provided a wild ride in terms of the highs and lows for unemployment, the first nine months of 2021 have displayed relatively more stability. However, this is not to say there have not been some reasonably sized fluctuations. Evidence for such can be seen in Figures 1 and 2 below. The precipitous rise in the unemployment rate in April 2020 was followed by a substantial and reasonably sustained decline. By September 2020, the unemployment rate for Howard County had fallen to 7.9%. The unemployment forecast at that time hinged on the COVID-19 vaccine. While the timing was unknown, the development and deployment of a vaccine was expected to lead to employment growing at a much faster pace and, thus, the unemployment rate would continue to fall.
Since the start of 2021, the unemployment rate has steadily declined in the U.S. and in the state of Indiana. However, Howard County has not had the same experience. In fact, the county’s rate stands well above the rate at the beginning of the year. One of the reasons behind the stickiness of Howard County’s unemployment rate can be tied to its heavy dependence on automobile manufacturing and the supply chain issues (especially in computer chip manufacturing) that remain. As can be seen in Figure 1, the Howard County unemployment rate has been consistently higher than Indiana’s throughout 2021, and it fell below the U.S. rate for only two months (January and March).
Figure 1: Unemployment rates
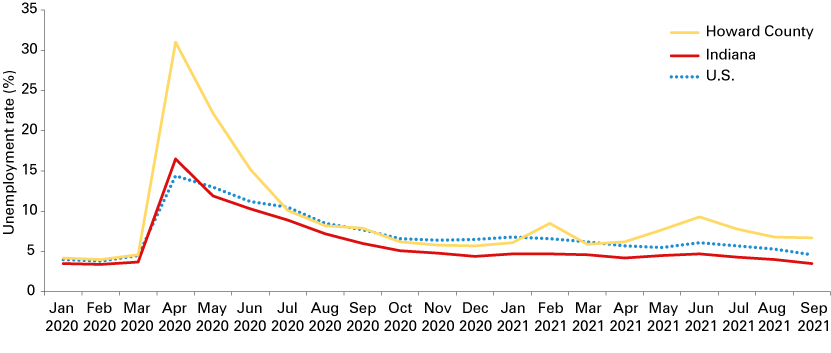
Note: Rates are not seasonally adjusted.
Source: STATS Indiana, using Local Area Unemployment Statistics (LAUS) from the U.S. Bureau of Labor Statistics
Howard County has consistently found itself with the highest level of unemployment among the larger 14-county region (see Figure 2). While Howard County’s unemployment rate has varied from a low of 6% to a high of 9.3%, only Miami County had an unemployment rate above 6%—and that was only in February and June. In fact, the majority of the region rarely, if ever, saw an unemployment rate above 5%. As has been routinely the case, Hamilton County has been the least affected by unemployment, with its unemployment rate only rising to 3.1% and currently sitting at just over 2.0% at the time of this writing.
Figure 2: Regional unemployment rates, 2021
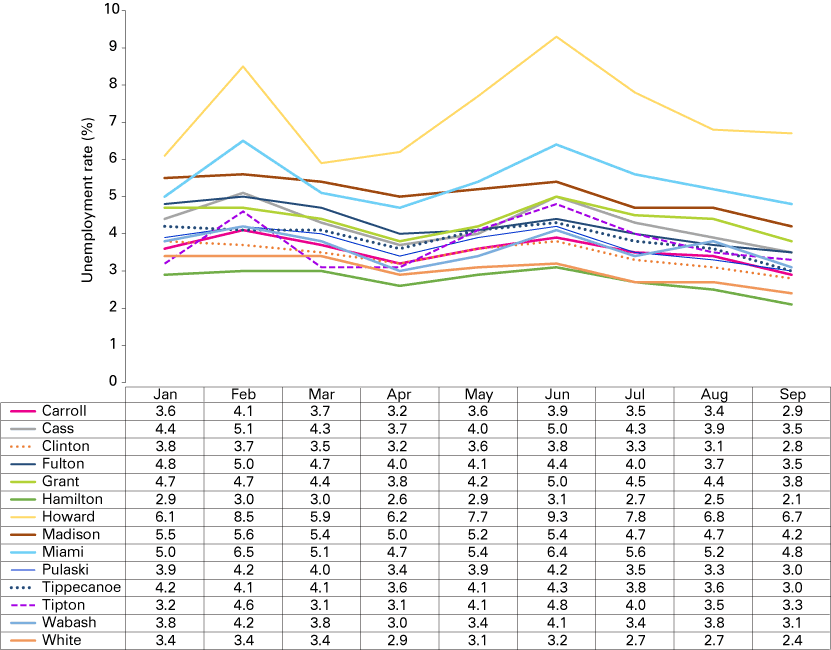
Note: Rates are not seasonally adjusted.
Source: STATS Indiana, using Local Area Unemployment Statistics (LAUS) from the U.S. Bureau of Labor Statistics
Challenges with interpreting the data
One of the significant challenges with drawing firm conclusions about what the unemployment rate represents has been the impact that federal unemployment compensation stimulus has played in impacting the size of the labor force. The stimulus supplements—initially $600 per week and eventually reduced to $300 per week before being eliminated—artificially boosted the unemployment “wage” by at least $10/hour and possibly as much as $20/hour. Thus, the incentive to return to work certainly didn’t exist. Furthermore, the need for higher base wages within the workplace also were needed to entice people back to work, given returning to work—especially with the continued existence of COVID-19—did not take into consideration the cost to families to pay for child care and transportation costs associated with working out of the house. The numerous “help wanted” signs posted inside the windows at many companies and the regular complaint by employers that they just can’t find people to work are evidence of such.
Another factor that has come into play has been a reduction in hours/shifts and even short-term furloughs, resulting from challenges with the supply chain. For example, as of early November 2021, the previously vacant parking lot at the former Delphi facility now is the location of more than 3,000 unfinished trucks. The size of this inventory is growing as more and more vehicles await parts, typically computer chips, that need to be installed before they are shipped to dealerships. It is important to note that this supply chain issue is not unique to Delphi or the automobile industry; however, given the heavy emphasis on manufacturing in the region, it does have the largest local impact.
The agricultural sector
In 2020, agricultural production bounced back from a very poor showing in 2019. Farmers entered the year hoping the cycle of alternative good and poor years wouldn’t continue. Based upon the data provided by the USDA, the cycle may have been broken. Table 1 shows the figures for corn production were in line with that of 2020, a record-setting year, given the same number of acres planted and harvested. However, yield per acre of corn and total corn production both jumped by 3.8% of the previous record year. Soybeans planted, harvested and yield per acre were nearly unchanged from 2020. While the number of acres of soybean planted and harvested were slightly less, the increases in yield helped total production slightly exceed 2020 production. Total year data for 2021 should be quite consistent with that of the October estimates as ideal harvesting weather allowed a sizable percentage of the soybean crop to be brought in (and only slightly less for corn). However, the latter half of October proved to be quite wet, so many farmers had to wait until November to get back in the fields to complete the 2021 harvest.
While corn production was up, prices per bushel also rose in 2021. From July to August 2021, the price per bushel rose by just $0.17—but in comparison to August 2020, the price per bushel rose by $2.91 or roughly 83.6%! Soybean producers saw somewhat similar changes. While from July to August 2021 prices per bushel fell by $0.70, year-over-year prices saw an increase from $8.80 to $13.60 per bushel, or 54.5%! With the change in administration and the easing of trade tensions between the U.S. and China, China is increasingly being seen as a destination for crop exports.
Table 1: Indiana crop planted, harvested, yield and production
| 2019 | 2020 | 2021* | |
|---|---|---|---|
| Corn | |||
| Planted (1,000 acres) | 5,000 | 5,400 | 5,400 |
| Harvested (1,000 acres) | 4,820 | 5,250 | 5,250 |
| Yield per acre (bushels) | 169 | 187 | 194 |
| Production (1,000 bushels) | 814,580 | 981,750 | 1,018,500 |
| Soybeans | |||
| Planted (1,000 acres) | 5,400 | 5,750 | 5,700 |
| Harvested (1,000 acres) | 5,360 | 5,730 | 5,690 |
| Yield per acre (bushels) | 51 | 59 | 60 |
| Production (1,000 bushels) | 273,360 | 338,070 | 341,400 |
* The 2021 data represent the forecast from October.
Source: “Indiana October Crop Production,” U.S. Department of Agriculture’s National Agricultural Statistics Service, October 2021
Hogs
Indiana hog producers reduced their inventory from September 2020 to September 2021 by 150,000 head, or roughly 3.4%, while the number heading for market was down 4.0% year over year. Following this trend, the average number of pigs retained per litter was down roughly 5.5% from 11.3 to 10.7. These figures are quite consistent with national figures in all aspects. While trade matters appear to be resolved, challenges still exist at meat processing plants due to the necessary COVID-19 precautions.
Forecast
The development of COVID-19 vaccinations has led to a rebound for the 14-county economic region. However, the extent of the recovery has been anything but equal across the region. Some counties, and especially Howard, are still struggling to bring unemployment rates down. Furthermore, a deeper analysis of other BLS unemployment rates, such as the U-6 rate, would likely reflect a less optimistic situation than what is portrayed by the tables above because it would count people who are underemployed or are considered part of the hard-core unemployed. Thus, the unemployment rates may be as much as 50% higher than that reported here.
A critical component of the future for this region is the ability to draw people into the working portion of the workforce, even if it means they may still be underemployed. For this to happen, several events need to take place. First, a larger portion of children, especially those in the 5-11 age range, need to participate in the COVID-19 vaccination effort. This will result in fewer infections and quarantines of close contacts. This age group is particularly important from a workforce perspective as those ages 12-18 would be more likely to be allowed to recover or quarantine at home without parental supervision. Secondly, the elevation of the overall vaccination rate—including booster shots—is important given that outbreaks, including breakthrough cases, are most likely inevitable. A third factor is the possibility of wage rates rising to the point that child care is more affordable for working parents, thus lessening this as a reason to remain out of the workforce.
Unfortunately, projections made by the Indiana University Center for Econometric Model Research do not provide very optimistic estimates of this workforce growth happening. From an employment expectation, out of 15 metropolitan statistical areas (MSAs) that are tracked, the Kokomo MSA anticipates only 1.3% growth in the level of employment per year from 2021 through 2024. This falls within the bottom third of all the MSAs examined. In terms of income growth, over that same time period, the Kokomo MSA is predicted to have the lowest growth rate of all the MSAs at 3.4% per year.
Several other external factors raise questions as to the potential prosperity of the region. One is the federal government’s efforts to mandate vaccination for workers in companies having more than 100 employees and those having governmental contracts. As has been seen with many of the federal, and also state, mandates related to COVID-19, the requirement for vaccinations and masking have faced protests and/or legal efforts to overturn them. Recently, for example, the state of Indiana indicated it was suing the federal government over the above-mentioned vaccine mandate. Uncertainty has led to reluctance on the part of people to reenter the workforce. Furthermore, employers have pushed back about enforcement of such mandates as it hinders their operations or may affect their costs. Some employers question whether not following such mandates runs the risk of having fines imposed or forced shutdowns until there is compliance.
Another matter involves concerns about the potential for future growth in inflation. Recently, the Federal Reserve announced its effort to scale back its bond buyback policy and with that a portion of the stimulus that has helped the economic recovery from the pandemic. Certainly, any programs passed by the legislature and signed by the president presents the chance to provide more stimulus. However, division—not just between political parties but also within parties—makes the likelihood and the scope of such less promising.
As emphasized earlier, this region is heavily dominated by manufacturing. One of the best options for our region’s economy is to continue to press efforts for our non-agricultural base to further push for diversification. This does not suggest the abandonment of our manufacturing roots. The Ventec partnership with General Motors on ventilator production was, in fact, a good start—but it was very short-lived. However, longer-term commitments in manufacturing areas beyond the transportation sector are necessary. Furthermore, it also means expanding the service economy.
As relates to the future of agriculture in the region, predicting such in any particular period is much like reading tea leaves, gazing into a crystal ball, or possibly even thumbing through the Farmers’ Almanac. After all, boom to bust years can happen in any year, and much can happen in a four- to six-month growing season. Despite such intentional ambiguity in a forecast, the fact is Indiana, and in particular this region, is blessed with some of the best soil for the production of crops and very little is likely to change. Furthermore, research by educational institutions and seed companies addressing the impact of winter cover crops, annual crop rotation and or enhanced hybridization promise to provide healthier, more resilient and, ultimately, much more productive plantings. This will provide greater stability to the agricultural market and fewer sleepless nights by those who tend the fields.
Notes
- This service region includes Howard County, along with the following counties: Carroll, Cass, Clinton, Fulton, Grant, Hamilton, Madison, Miami, Pulaski, Tippecanoe, Tipton, Wabash and White.
References
- “Indiana MSA forecast,” Indiana University Center for Econometric Model Research, September 2021, https://ibrc.kelley.iu.edu/analysis/cemr/
- “Indiana October crop production,” U.S. Department of Agriculture’s National Agricultural Statistics Service, October 2021, www.nass.usda.gov/Statistics_by_State/Indiana/Publications/Current_News_Release/2021/nr2147in.pdf
- “Labor force estimates and unemployment rates,” STATS Indiana, www.stats.indiana.edu/topic/laus.asp
