
Indiana’s positive housing market outlook for 2022

Senior Demographic Analyst, Indiana Business Research Center, Indiana University Kelley School of Business
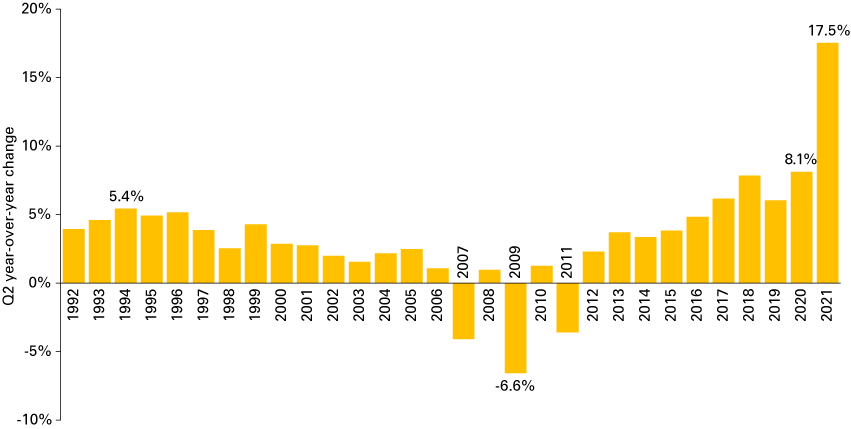
Indiana’s housing market was swept into uncharted waters in 2021. Through a combination of scarce market inventory, strong buyer demand and rock-bottom mortgage rates, Indiana house prices rose by an unprecedented 17.5% year-over-year in the second quarter (see Table 1). Hoosier housing markets became so tight over the summer selling season that the state’s so-called months supply of inventory measure fell below one month (six months of supply is considered the benchmark of a balanced market), and bidding wars became the norm as the state’s average sale price for existing homes exceeded the list price.
Table 1: Indiana housing market by the numbers
| U.S. | Indiana | |
|---|---|---|
| Existing home sales, September 2021 year-to-date, year-over-year change | 13.5% | 4.9% |
| House price appreciation, 2020 Q2 to 2021 Q2 | 16.5% | 17.5% |
| Single-family building permits, September 2021 year-to-date, year-over-year change | 21.2% | 23.5% |
| Multifamily building permits (number of units), September 2021 year-to-date, year-over-year change | 26.6% | 8.1% |
| Months supply of inventory, September 2021 | 2.4 | 1.2 |
| Rental vacancy rate, 2021 Q3 | 5.8% | 6.4% |
| Foreclosure rate, 2021 Q3 | 0.5% | 0.5% |
Sources: Indiana Association of Realtors, National Association of Realtors, Federal Housing Finance Agency, U.S. Census Bureau and the Mortgage Bankers Association
As Figure 1 shows, Indiana’s annual rate of house price appreciation for the second quarter of 2021 was more than twice as large as the previous high set just the year before, and more than three-times as large as any annual increase seen before this recent run-up in prices. Surging prices are not unique to Indiana, however. The state’s rate of appreciation in the second quarter ranks only 20th nationally. The greatest spikes have occurred out west, with Idaho’s house prices up 35% over this same period, followed by Utah and Arizona with each posting increases above 25%.
Figure 1: Indiana house price index, second quarter year-over-year change
Source: Federal Housing Finance Agency
Of course, such price gains will push homeownership out of the reach of many Hoosiers, at least for the time being. According to the Federal Reserve Bank of Atlanta, “homeownership affordability” in the 11-county Indianapolis metro area declined by 13% between January and August of this year (see Figure 2). Among Indiana’s other large metro areas, Fort Wayne, Evansville, South Bend, Lafayette and Elkhart also show double-digit declines over this period. According to this measure—where an index value of 100 or higher indicates that homeownership is affordable—housing remains affordable for a median-income household in each of Indiana’s metro areas, although homeownership costs in Lafayette and Bloomington are approaching unaffordable.
Figure 2: Homeownership affordability index
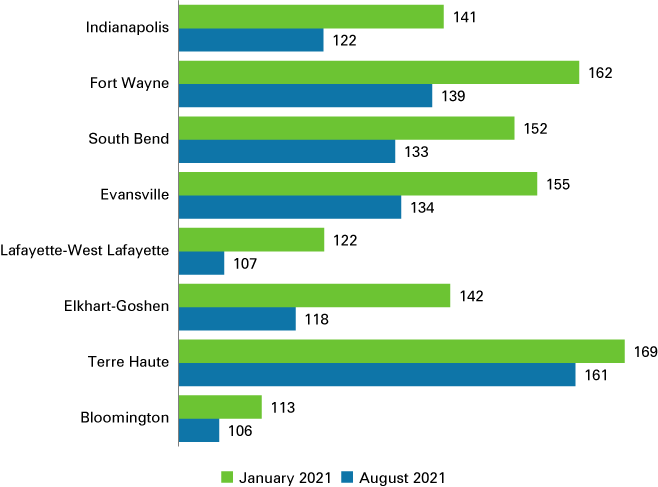
Note: An index value of 100 or higher indicates that homeownership is affordable for a median-income household. This chart is sorted by overall population size.
Source: Federal Reserve Bank of Atlanta, Home Ownership Affordability Monitor
In response to these dynamics in the existing home market, new single-family construction in Indiana is up nearly 24% year-over-year through the third quarter and is on pace to be the state’s strongest year since 2006. This much-needed boost in construction has helped to narrow the sizable gap that has developed between existing home sales and housing starts since the mid-2000s.
Between 1988 and 2005, there was a consistent ratio of approximately two existing home sales for each single-family building permit in Indiana. Over the next 15 years, however, that ratio jumped to nearly 5.5 existing home sales per housing start (see Figure 3). In 2021, even with what should be a record year for existing home sales in the state, this ratio will be closer to 4-to-1. We will likely have to see the construction of more low-to-moderate priced homes to help bring even more balance to the market.
Figure 3: Indiana existing home sales and single-family building permits
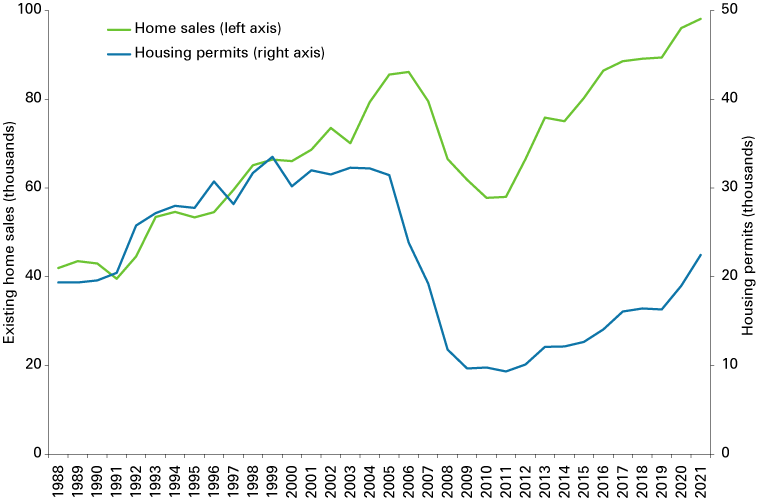
Note: The IBRC estimated the values for 2021 based on data for the first three quarters of the year.
Source: U.S. Census Bureau, Moody’s Economy.com and the Indiana Association of Realtors
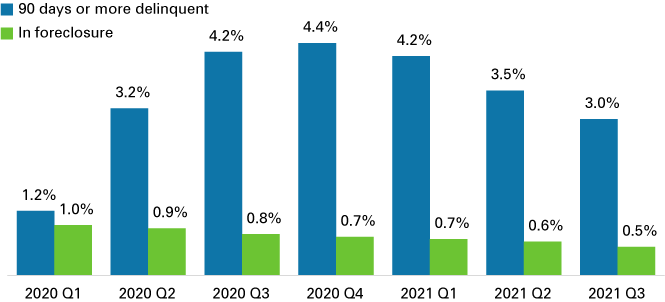
Another positive development has been an improved mortgage delinquency situation in the state. Although foreclosure moratoriums helped most struggling homeowners stay put, the share of Hoosiers who were behind on their mortgages by at least three months increased sharply through the darkest days of the pandemic (see Figure 4). Indiana’s seriously delinquent rate has improved along with the economy so far in 2021. Better yet, even though the federal foreclosure moratorium ended this past summer, the state’s foreclosure rate continued to decline in the third quarter and remains exceptionally low.
Figure 4: Indiana mortgage delinquencies
Source: Mortgage Bankers Association
Housing market outlook
At the national level, forecasters from the Mortgage Bankers Association and Fannie Mae expect continued growth in single-family housing starts in 2022, while the number of existing home sales will be roughly the same as this year (see Table 2). Meanwhile, the rate of house price appreciation should start to come back down to earth as mortgage rates begin to increase slowly.
Table 2: National housing market outlook
| 2021 | 2022 | Percent change | |
|---|---|---|---|
| Single-family housing starts (thousands) | 1,138 | 1,227 | 7.9% |
| Existing home sales (thousands) | 6,026 | 6,033 | 0.1% |
| House price appreciation, annual percent change | 16.3% | 6.3% | - |
| 30-year fixed mortgage rate | 3.0% | 3.7% | - |
Note: The values in this table are an average of the projections from each organization’s October 2021 economic forecasts.
Source: Fannie Mae and Mortgage Bankers Association
We expect much the same here in Indiana. The state will continue to see strong house price gains, but this measure will surely fall from its current unsustainable heights. With the inventory of existing homes on the market still extremely tight, the number of new single-family housing starts will continue to improve, and hopefully bring more balance to the market. Finally, although affordability concerns continue to loom, there should still be healthy buyer demand for existing homes next year, but the state’s final sales total will likely fall short of what will be a record tally this year. All in all, the Indiana housing market appears set for another strong year in 2022.


